
Fig. 4.
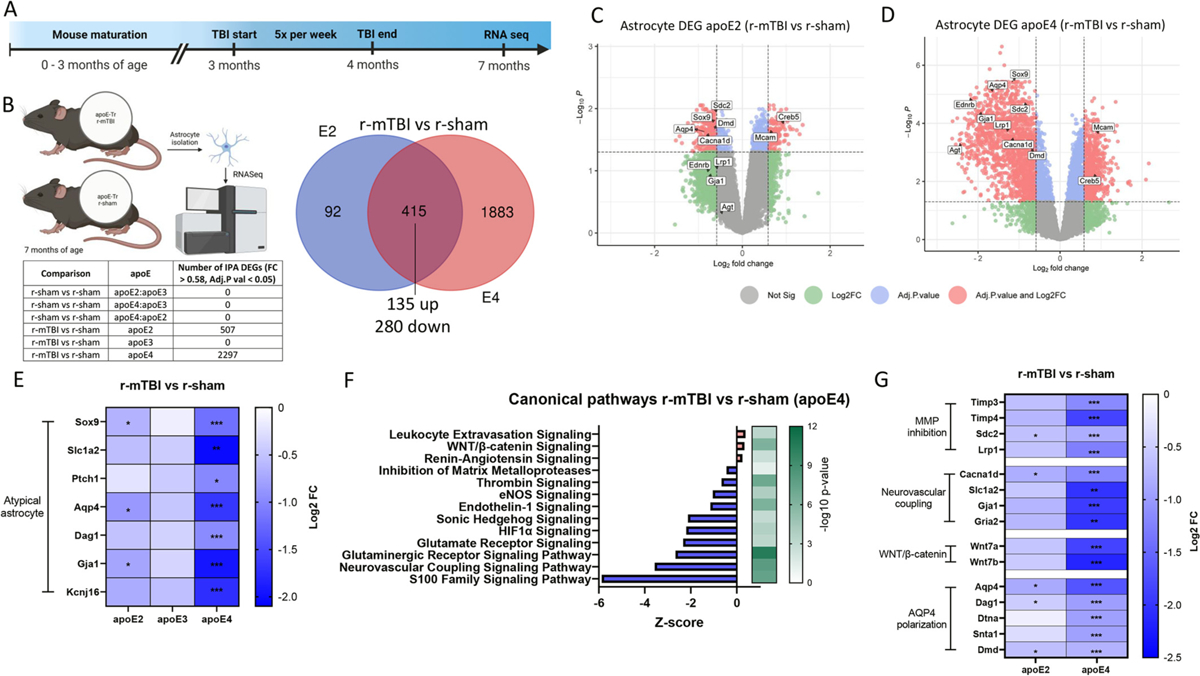
Enriched atypical reactive astrocyte profile by apoE4 in r-mTBI mouse model.
(a-f) RNA was extracted from astrocytes isolated from 7 month old r-sham and r-mTBI (apoE2, apoE3 and apoE4) mice, and gene ontology analysis of r-mTBI astrocytes (versus each respective r-sham) was performed to identify enriched canonical pathways. (a) Timeline of accelerated closed head injury paradigm. (b) Venn diagram of the significantly differentially expressed genes (DEGs) affected by injury for apoE2 and apoE4 (adjusted P < 0.05, |fold change| > 0.58). All common DEGs between apoE2 and apoE4 r-mTBI (compared to their respective shams) changed in a consistent direction. (c, d) Volcano plots of DEGs in r-mTBI versus sham astrocytes isolated from (c) apoE2 and (d) apoE4 mice (significant cut off set at adjusted P < 0.05, |fold change| > 0.58, red points indicate DEGs above both the adjusted p value and Log2FC cut off threshold). (e) Heatmap showing fold change (FC) values (compared to respective r-shams) of genes correlating with the atypical reactive astrocyte phenotype signatures across injury groups. (f) Results of enrichment analysis comparing the DEGs in astrocytes isolated from r-mTBI and r-sham apoE4 mice to the ingenuity knowledge base, showing top significantly dysregulated canonical pathways. Orange, upregulated; blue, downregulated genes/functions. (g) Heatmap showing downregulated FC values compared to values in respective r-shams of DEGs involved in Matrix metalloprotease inhibition (Timp3, Timp4, Sdc2, Lrp1), Neurovascular coupling (Cacna1d, Sl1a2, Gja1, Gria2), and WNT/β-catenin signaling (Wnt7a, Wnt7b), and glymphatic system-associated AQP4 polarization (Aqp4, Dag1, Dtna, Snta1, Dmd). Significance reflects adjusted P < 0.05, |FC| > 0.58.