
Fig. 5.
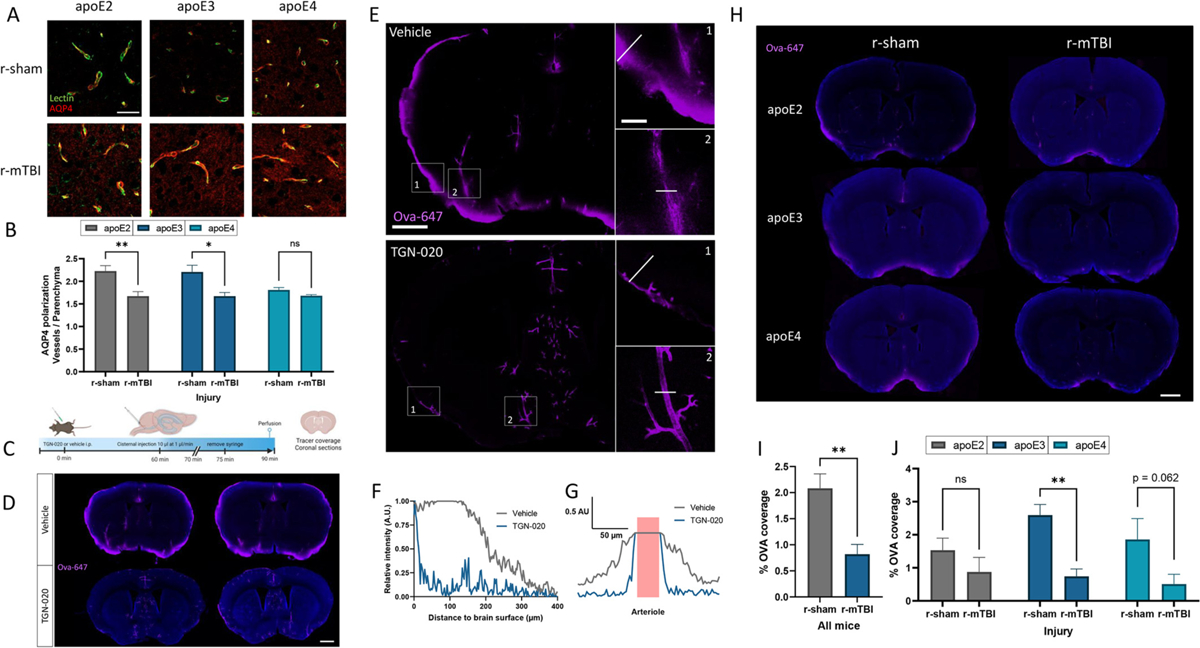
Influence of apoE and insult on glymphatic influx.
(a) Confocal microscopy of AQP4 (red) and lectin-positive brain capillaries (green) in the somatosensory cortex of 24 month old r-sham and r-mTBI mice (apoE2, apoE3 and apoE4). Scale bar, 25 μm. (b) Quantification of AQP4 polarization measured as the ratio of signal around the capillary divided by the signal in the surrounding parenchyma. Values represent mean + SEM (n = 4). *P < 0.05, **P < 0.01 as determined by two-way ANOVA and Bonferroni’s multiple comparisons test. (c-g) The effect of pharmacological inhibition of AQP4 on the CSF-ISF exchange was examined in wild-type mice (6 months) by injecting TGN-020 (250 mg/kg) or vehicle i.p., followed by an intracisternal injection of the CSF tracer ovalbumin-647. 30 min after the intracisternal injection, mice were perfused with 4% PFA and the distribution of the CSF influx tracer was probed in brain slices. (d) Representative confocal microscopic images showing Ova (magenta) influx with Dapi staining (blue). Scale bar, 1.0 mm. (e) Representative images showing Ova (magenta) distribution and influx in coronal sections. Insets 1 and 2 show the boxed areas in (e). Scale bar full images, 1.0 mm. Scale bar insets, 250 μm. (f) Tracer penetration depth profile, normalized to the fluorescence at the pial surface of a coronal section. The line in insert 1 was placed orthogonal to the cortical surface at the most dorsal position in the TGN-020 treated mouse where tracer could be found at the pial surface, and depth was measured at the same position in the untreated mouse. (g) Tracer perivascular influx profile, normalized to the fluorescence at the pial surface of a cortical section. The line in insert 2 was placed across a penetrating artery, and distribution of Ova was assessed from the arterial lumen. Vessel lumen in pink. (h-j) The effect of r-mTBI on CSF-ISF exchange was examined in 24 month old r-sham and r-mTBI (apoE2, apoE3, and apoE4) mice by injecting the CSF tracer Ova into the cisterna magna. Brains were harvested 30 min following the injection, and the Ova influx was quantified. (h) Representative confocal microscopic images showing Ova (magenta) coverage with Dapi staining (blue). Scale bar, 1.0 mm. (i, j) Quantification of Ova coverage on brain coronal sections. (i) Values represent mean + SEM (n = 12). (j) Values represent mean + SEM (n = 4). **P < 0.01 as determined by two-way ANOVA and Bonferroni’s multiple comparisons test.