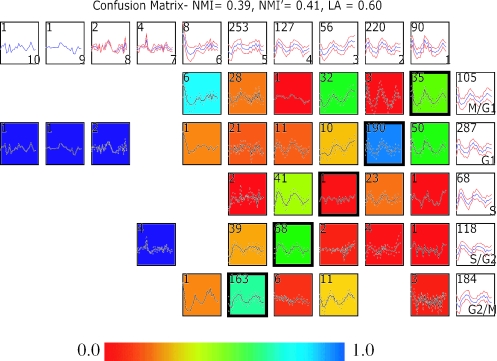
Figure 2.
Comparing two clustering results on a ratiometric microarray dataset using a confusion array. Shown in this comparison is a Fourier clustering result published in the original study by Spellman et al. (16) and results from running an unsupervised clustering (Xclustagglom, see Methods) on the same ratiometric microarray dataset as the Fourier analysis was run on. Details of the figure layout are discussed in the legend of Figure 1. Here, the 5 Fourier clusters are shown along the rows, while the 10 Xclustagglom clusters are displayed across the columns.

