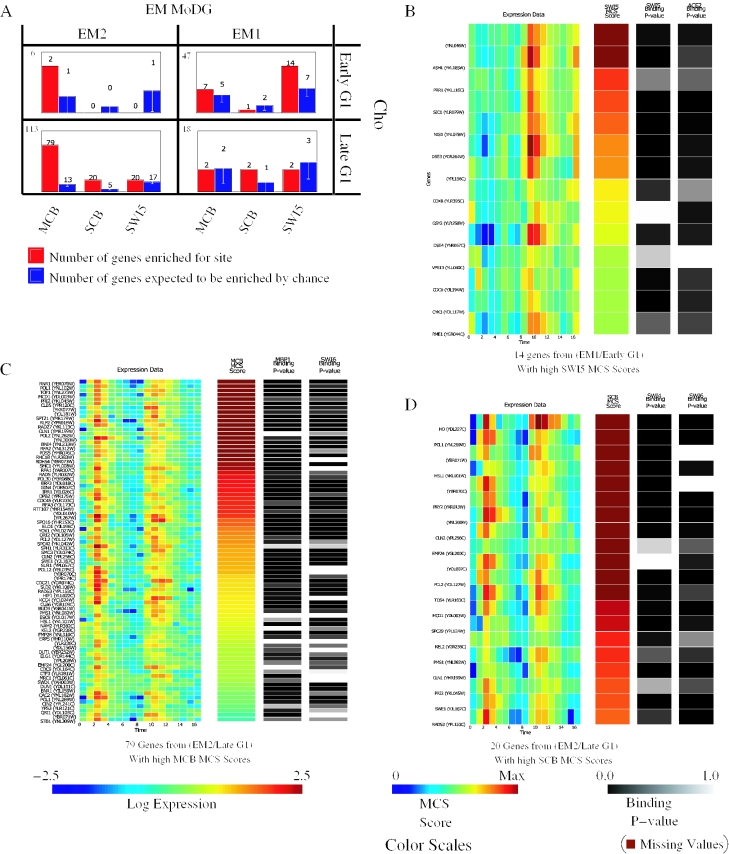
Figure 8.
Integrating expression data, regulatory motif conservation and protein–DNA binding information. (A) Binding site enrichment in genes from the four confusion matrix cells of Figure 7 that dissect genes in the G1 cell cycle phase. Shown in red are the observed number of genes with a MCS score above threshold for each motif. Shown in blue are the number of genes expected by chance, as computed by bootstrap simulations. The total number of genes each cell contains is in the upper left. (B–D) Heat-map displays showing expression data on the left, followed by MCS scores for a specified motif, followed by in vivo protein–DNA binding data for transcription factors implicated in binding to the specified consensus. Color scales for each panel are at the bottom of the figure. For the MCS scores, the color map ranges from 0 to the 99th percentile to minimize the influence of extreme outliers on interpretation. (B) Shown are 14 genes that fall within the EM1/Early G1 intersection cell and have a conserved enrichment in the presence of the SWI5 consensus as measured by MCS scores (see Methods; Equations 4–9) (C) Shown are 79 genes that fall within EM2/Late G1 intersection cell and have a high MCS score for MCB. (D) Shown are 20 genes that fall within EM2/Late G1 intersection cell and have a high MCS score for SCB. In each heat-map genes are ordered by decreasing MCS score. Significant correlation can be seen between a high MCS score, protein–DNA binding and the expected expression pattern.

