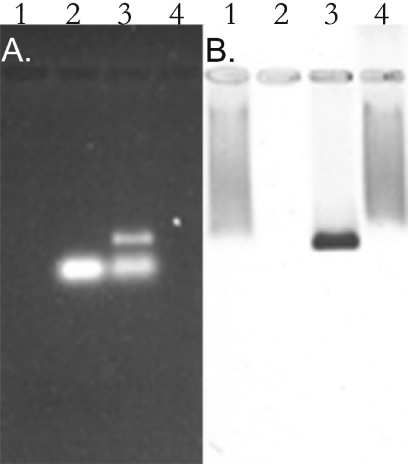
Figure 5.
Effect of RNase A treatment on connector–pRNA complex. An aliquot of 0.8% agarose gel stained by ethidium bromide showing pRNA (A) and the same gel stained by Coomassie brilliant blue showing the connector protein (B) to evaluate RNase A digestion of the connector–pRNA complex. Lane 1, the purified 120 pmol gp10 alone (10 pmol connector); lane 2, 12 pmol pRNA alone; lane 3, connector–pRNA complex with a molar ratio of 1:1.2 in the presence of Mg2+; lane 4, the same connector–pRNA complex sample as in lane 3 treated with 1 μg/μl RNase A.

