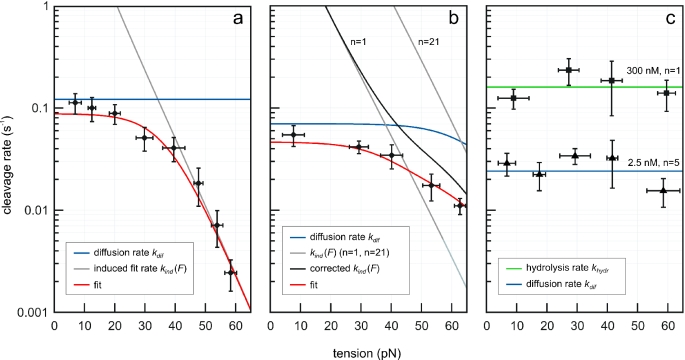
Figure 5.
Measured cleavage rate versus DNA tension. (a) The effect of tension on cleavage of linearized pCco5 by EcoRV (number of recognition sites n = 1). EcoRV concentration was 25 nM in terms of dimers. The total amount of cutting events was 68. (b) EcoRV on Lambda phage DNA (n = 21), 32 cutting events. (c) Tension dependence on DNA cleavage by BamHI (300 nM) on the pCco5 derivative containing a single recognition site (squares, 78 events) and on Lambda phage DNA with five BamHI sites (triangles, 28 events) using 2.5 nM BamHI. Each point consists of at least 6 cleavage events. Vertical error bars represent the standard error of the mean rate. Horizontal error bars are the standard deviation of the combined DNA tensions (a result of the binning). The data in (a and b) are fitted to the described model (normalized χ2 are 0.6 and 0.2, respectively). The BamHI rates in (c) do not significantly vary with DNA tension and were fitted with constant values [normalized χ2 are 0.8 (hydrolysis, green line) and 1.6 (diffusion, blue line)].

