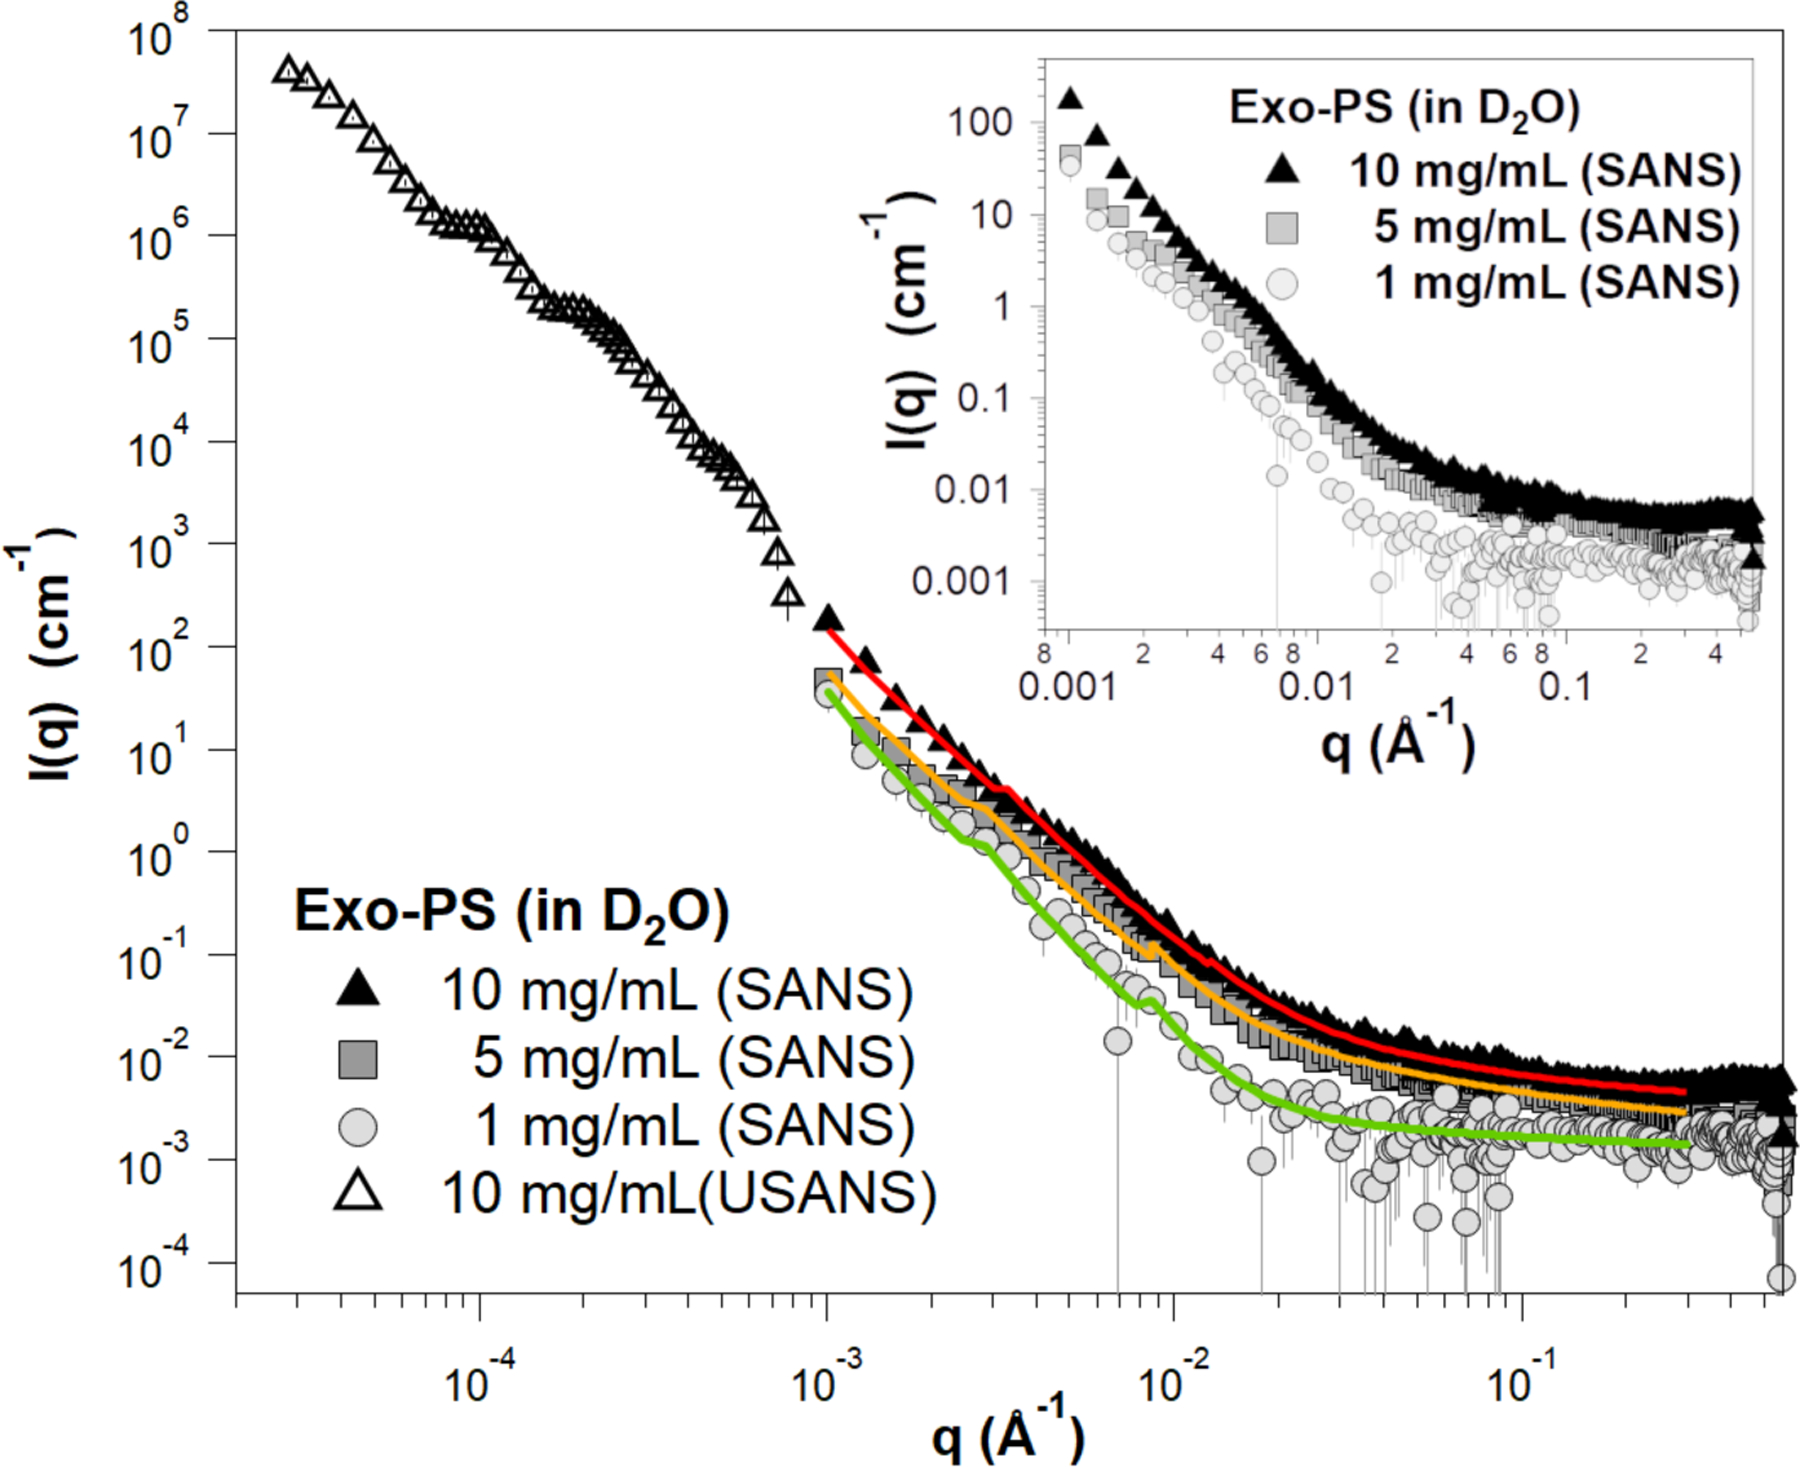
Figure 3.

Background-subtracted, reduced SANS, and USANS data for the exo-PS solutions in D2O at varying concentrations. The USANS data shown has been desmeared using the macro-routines for Igor provided by the NCNR to account for the slit-smearing effects of the BT5 instrument on the experimental data. The solid lines depict SANS data fits for the solutions at 1 mg/mL (green), 5 mg/mL (orange), and 10 mg/mL (red) exo-PS; it should be noted that the small discontinuities in the line fit at q ≈ 0.03 Å−1 and q ≈ 0.09 Å−1 are a resolution artifact related to the instrumental configurations used for data collection and are not indicative of a sample-related scattering characteristic. The inset provides an enlarged view of the SANS data to highlight the distinctions observed between different concentrations. The error bars represent standard errors derived from counting statistics and, when not visibly discernible, are smaller than the corresponding data markers.
