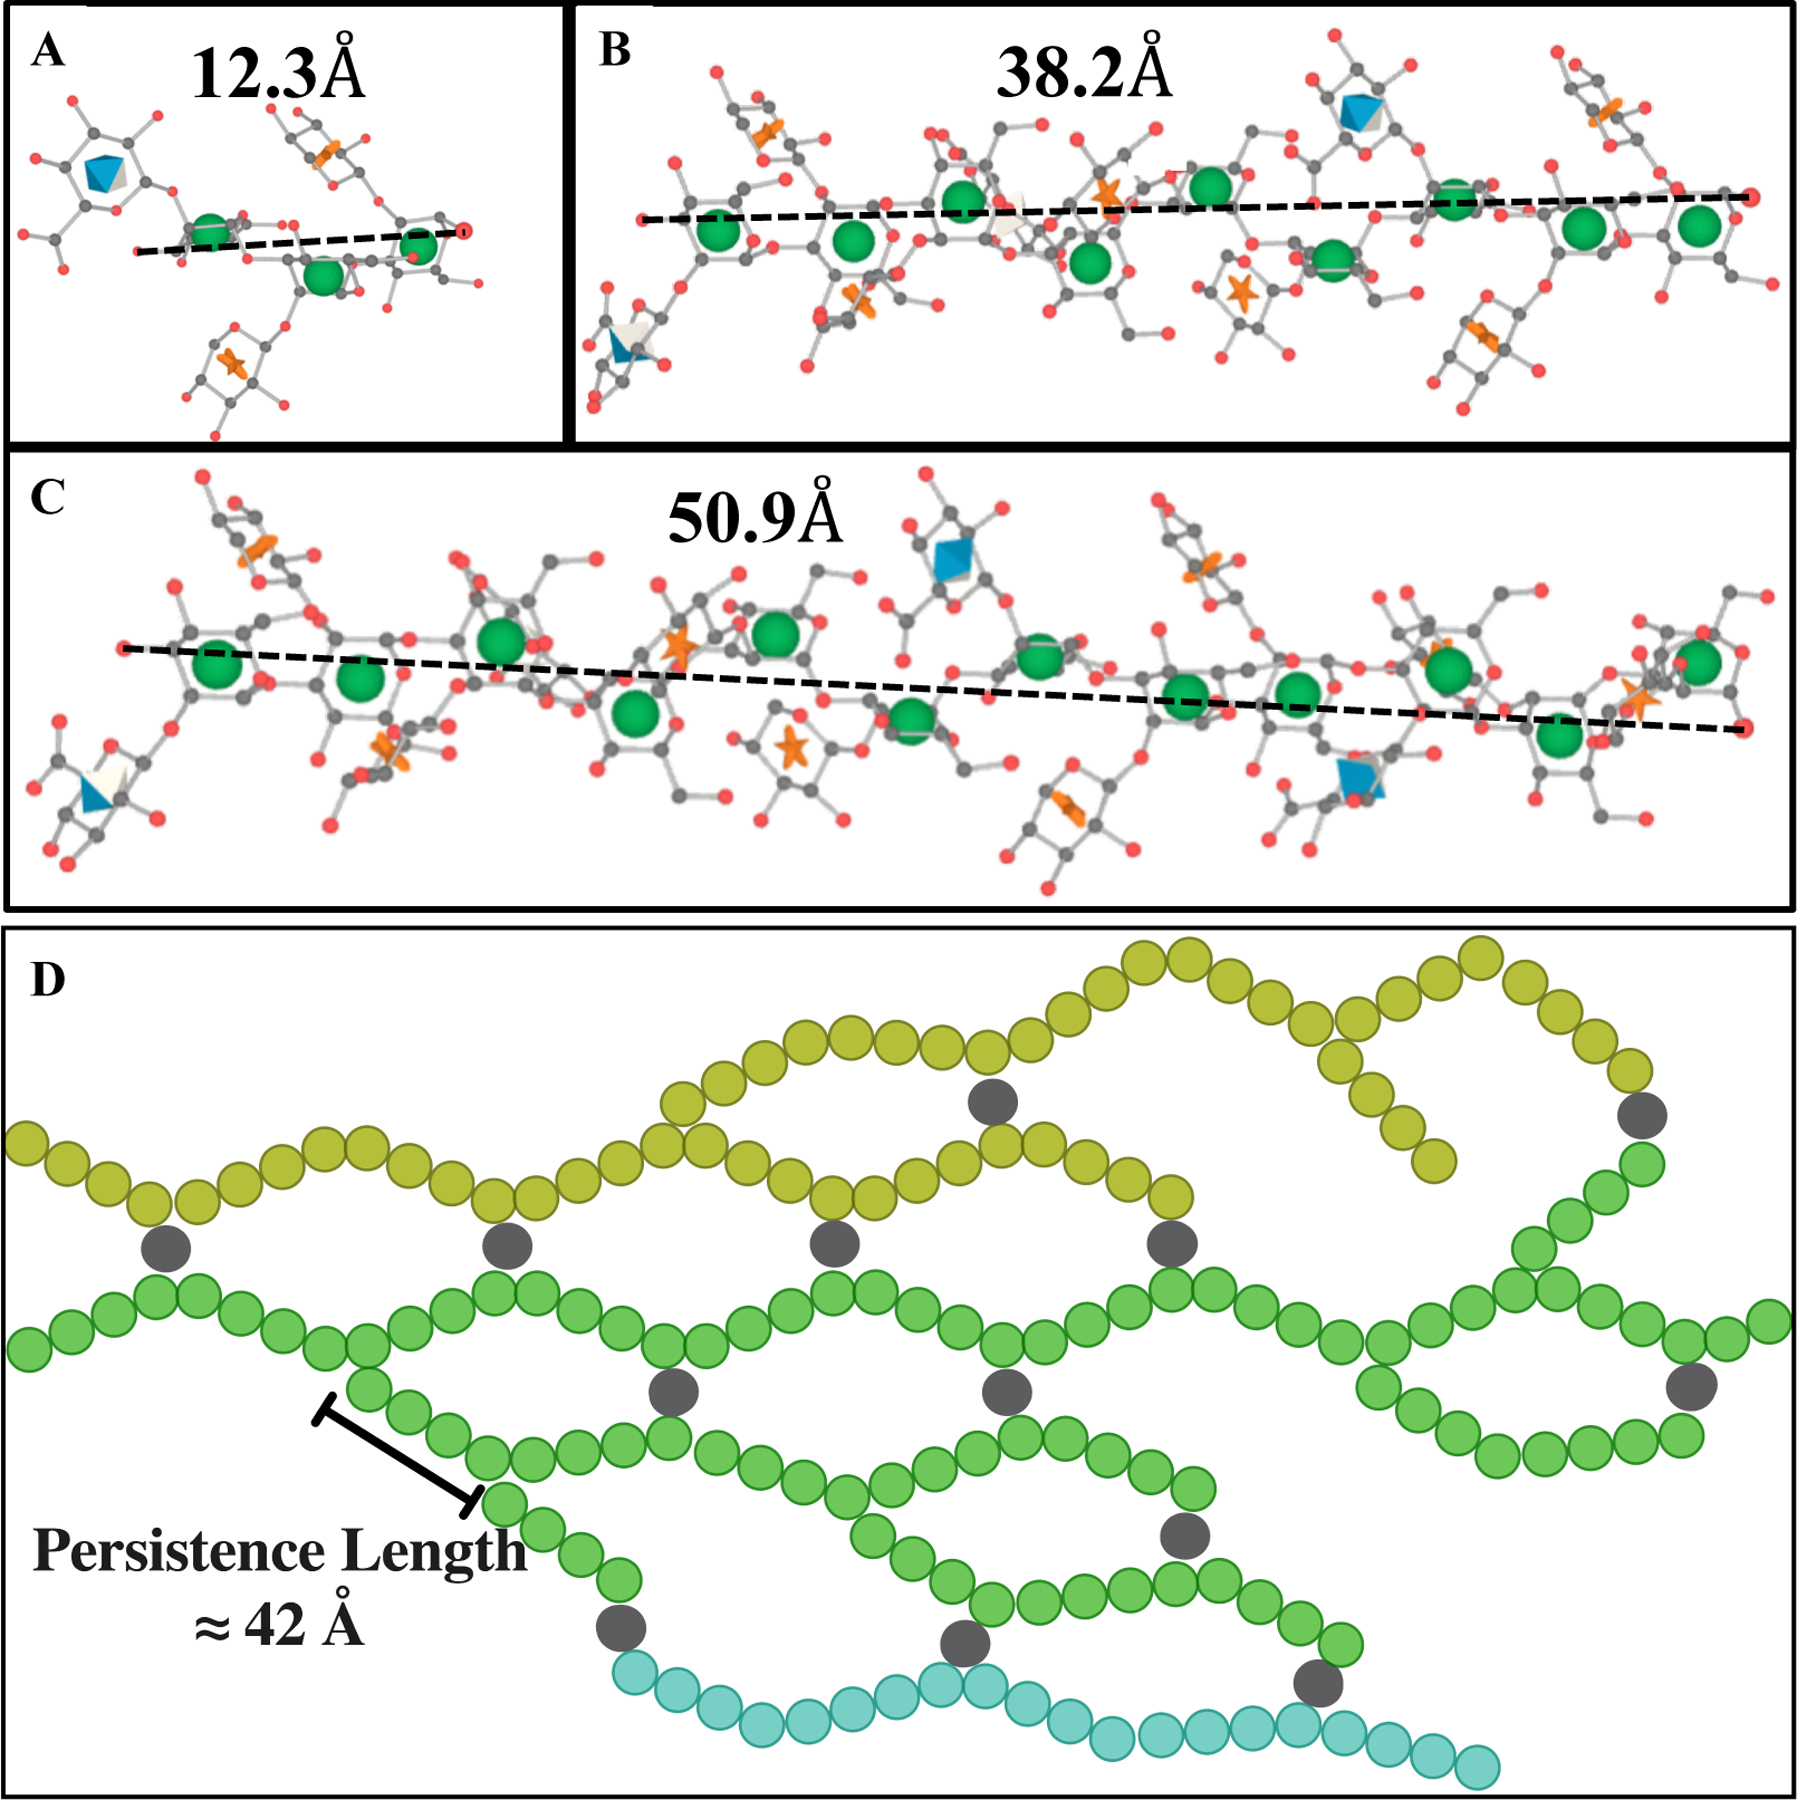
Figure 4.

Schematic representation of M2 motif and exo-PS in water for one M2 (A), three M2 (B), and four M2 (C) triads, drawn and energy minimized using GLYCAM38. Residues are represented by their symbol nomenclature: green sphere for mannose, orange start for xylose, and blue diamond for GlcA. The distance between the two furthest oxygens that connect mannoses was measured to determine the approximate length of one (12.3 Å), three (38.2 Å), or four (50.9 Å) triads, respectively. (D) The exo-PS in water is drawn in 2D to suggest a compatible arrangement of the exo-PS structure, where each circle (except gray circles that represent divalent cations) represents one triad, and three exemplar chains are represented with different colors. A potential pattern of intra- and inter-chain ionic bridging by the divalent cations such as Mg2+ and Ca2+ (represented by gray circles) present in the cell culture media. The corresponding estimated persistence length (length of the region with rigid rod behavior) is approximately 42 Å. Image created with BioRender.com.
