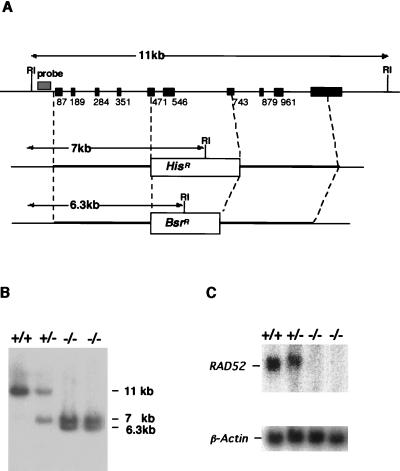
FIG. 1.
Strategy of disruption of the RAD52 gene. (A) Schematic representation of part of the RAD52 locus, the two gene disruption constructs, and the configuration of the targeted loci. Solid boxes indicate the positions of exons; numbers show the 3′ nucleotide of each exon relative to the start codon (4). Relevant EcoRI recognition sites are indicated by RI. (B) Southern blot analysis of EcoRI-digested DNA from the indicated genotypes with the probe shown in panel A. The positions and sizes of the hybridizing fragments of the wild-type and targeted loci are indicated. (C) Northern blot analysis of total RNA with the full-length chicken RAD52 cDNA as a probe. The same filter was rehybridized with a chicken β-Actin probe (7).

