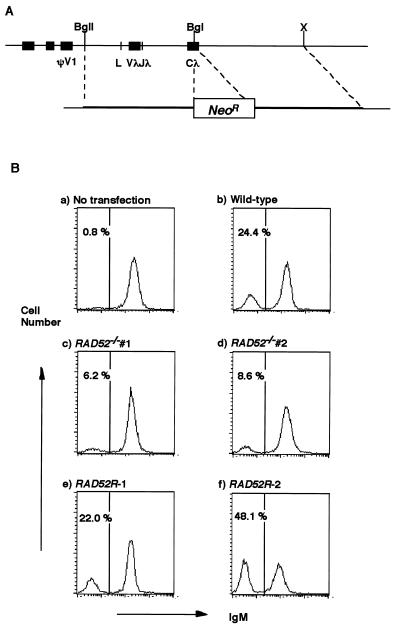
FIG. 4.
Measurement of targeted integration frequencies at the Igλ locus. (A) Schematic representation of part of the rearranged Igλ locus and the disruption construct (Igλ-neo). ΨV1, first pseudogene; L, leader sequence; Vλ, variable gene segment; Jλ, joining gene segment; Cλ, constant gene segment. BglI (BgI), BglII (BgII), and XbaI (X) restriction sites are indicated. Not all BglI sites in this region are shown. (B) Histograms of sIgM expression of wild-type (a and b), RAD52−/− (c and d), and RAD52 cDNA-reconstituted RAD52−/− (RAD52R) (e and f) clones after no transfection (a) or transfection of Igλ-neo and G418 selection of transfectants of each clone (b to f). The x and y axes show the fluorescence intensity from an FITC-conjugated anti-IgM polyclonal antibody on a logarithmic scale and the cell number on a linear scale in each graph, respectively. The percentage of cells losing sIgM expression is shown in each panel.

