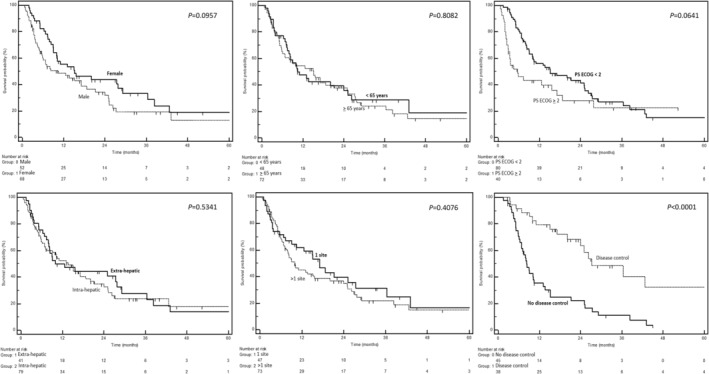
FIGURE 1.

Kaplan–Meier curves depicting overall survival, stratified by potential prognostic factors (as indicated in each figure). The p‐values from the log‐rank test are presented alongside each curve.

Kaplan–Meier curves depicting overall survival, stratified by potential prognostic factors (as indicated in each figure). The p‐values from the log‐rank test are presented alongside each curve.