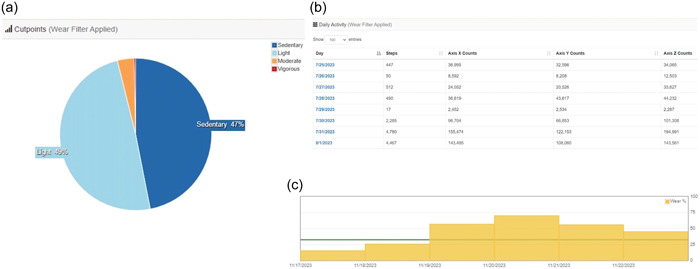
Figure 2.

Sample ActiGraph data. Sample ActiGraph data demonstrating (a) activity intensity, (b) activity counts per day (used to compute vector magnitude counts), and (C) wear time at different time points are demonstrated. In panel C, the minimum daily wear time of 8 h is designated by the green horizonal line.
