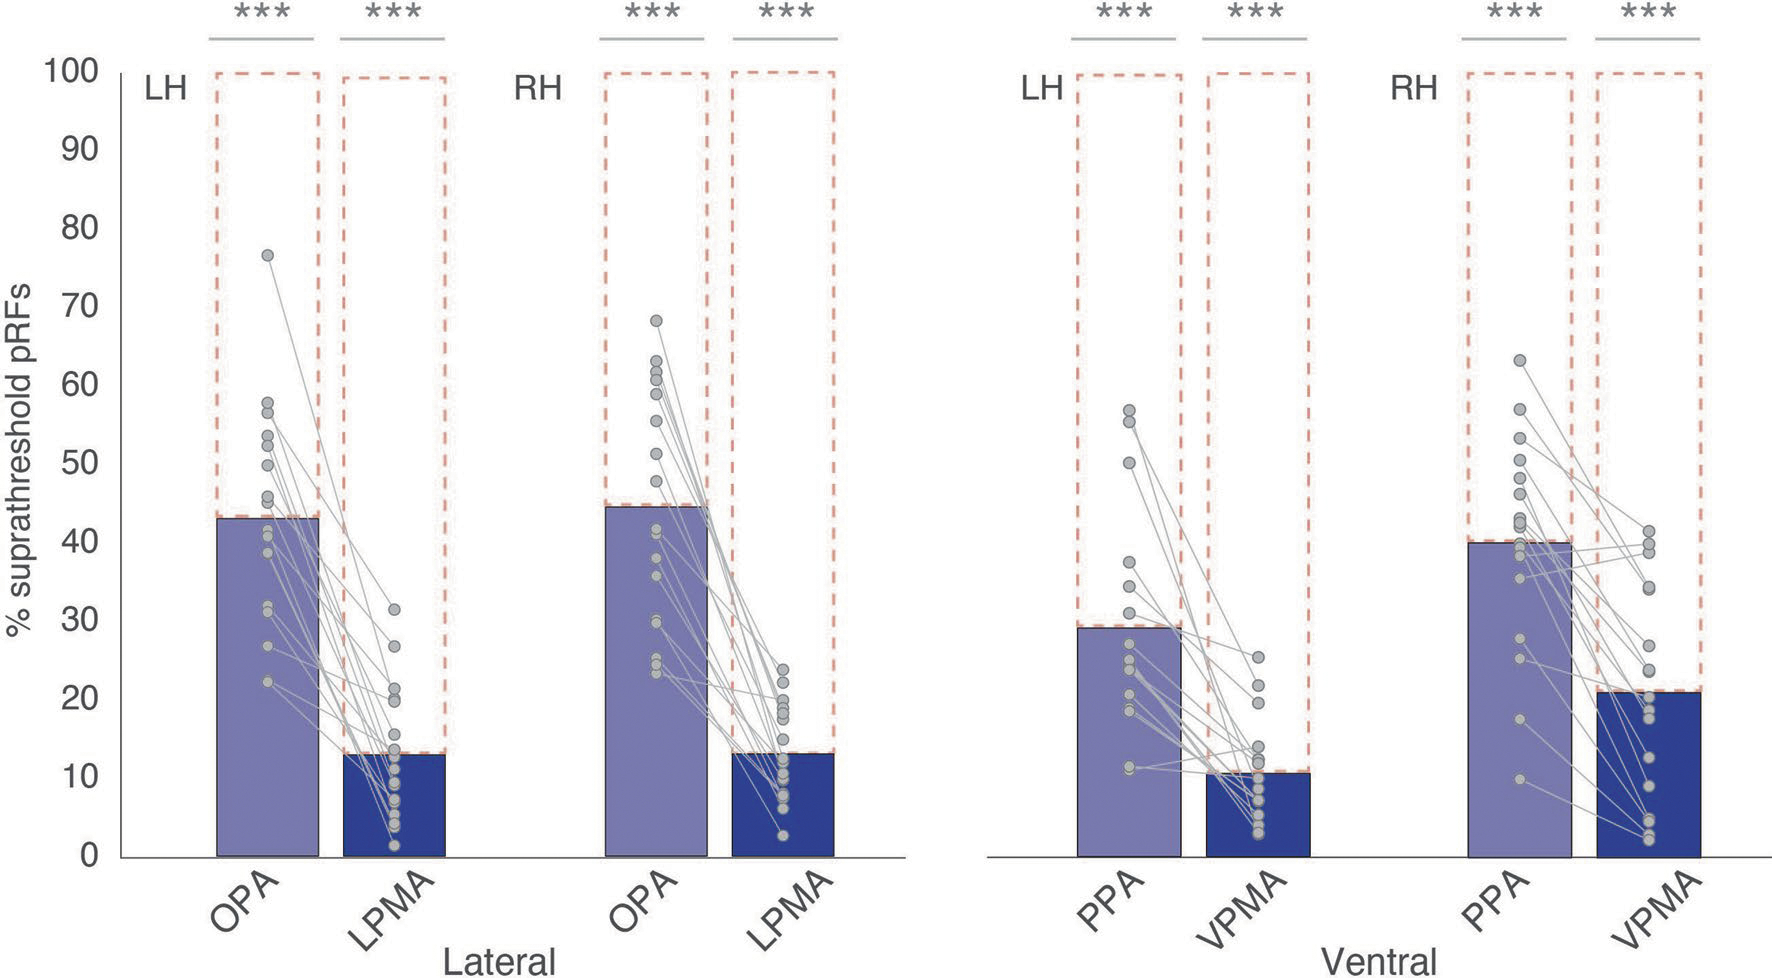
Extended Data Fig. 2 |. Retinotopic coding in SPAs and PMAs.

To quantify the extent to which retinotopic coding is expressed within each ROI we first calculated the percentage of suprathreshold pRFs (R2 > 0.08) within our ROIs for each subject separately before testing each against a non-retinotopic prediction using t-tests (that is, t-test versus zero, with Bonferroni correction). Retinotopic coding was significantly present within each ROI (LH; OPA: t(12.51)=, pcorr = 3.35–9, D = 2.99; PPA: t(16) = 8.68, pcorr = 5.67–7, D = 2.17; LPMA: t(16) = 6.23, pcorr = 3.58–5, D = 1.59; VPMA: t(16) = 6.65, pcorr = 1.64–5, D = 1.66; RH; OPA: t(16) = 12.15, pcorr = 5.10–9, D = 3.03; PPA: t(16) = 11.97, pcorr = 6.32–9, D = 3.12; LPMA: t(16) = 8.75, pcorr = 5.05–7, D = 2.18; VPMA: t(16) = 6.39, pcorr = 2.68–5, D = 1.55). Bars represent the mean percentage of suprathreshold pRFs (R2 > 0.08) in each ROI/hemisphere for the lateral (left) and ventral (right) surfaces, respectively. Individual data points are overlaid. Each ROI exhibited a significant percentage of suprathreshold pRFs, ***ptwo-tailed < 0.001.
