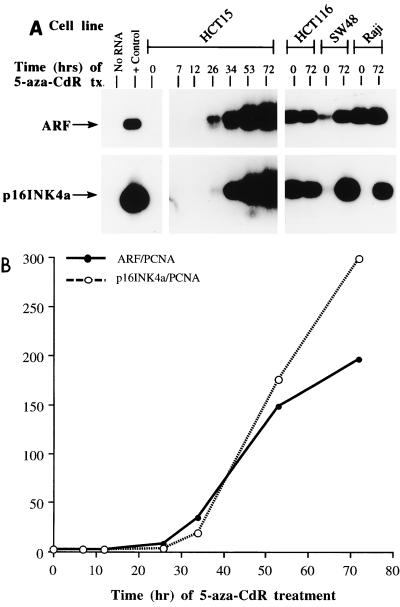
FIG. 1.
(A) RT-PCR analysis of ARF (top) and p16 INK4a (bottom) expression patterns in the HCT15 cell line after treatment with 1.0 μM 5-aza-CdR for the times indicated. Also shown is a single time point (72 h) for the SW48, HCT116, and Raji cell lines. Hep 3B RNA was used as the positive (+) control. PCR products were probed with oligonucleotides specific for the unique first exon of each transcript, and RNA integrity was verified by amplification of transcripts for β-actin and PCNA (not shown). Note that a longer exposure is shown for the HCT15 5-aza-CdR time course experiment in order to emphasize differences at the earlier time points. (B) Quantitation of the results in panel A for the HCT15 cell line relative to the ubiquitously expressed transcript for PCNA.

