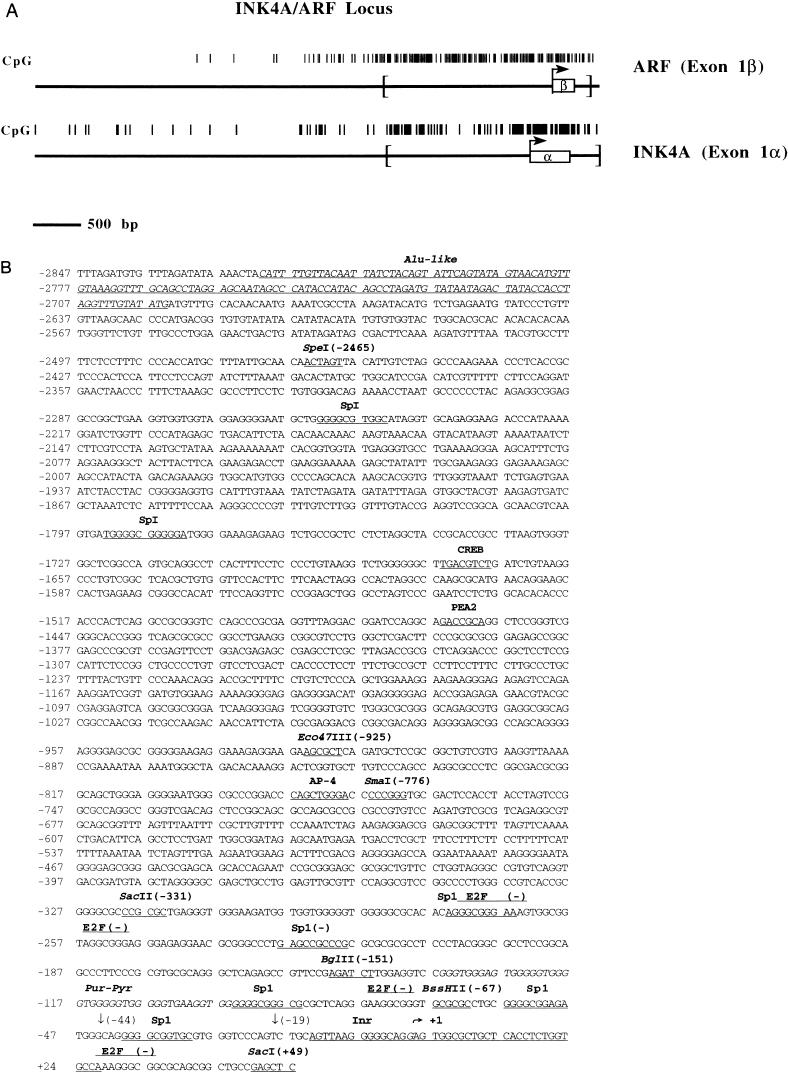
FIG. 2.
(A) Plots comparing the frequency of the CpG dinucleotide in the ARF promoter/exon 1β region (top) and the INK4a/exon 1α region (bottom) derived from GenBank accession no. AC000048. Bent arrows are the transcription start sites, and open boxes are transcribed regions. Analysis of the regions of each promoter denoted by the brackets in terms of their CpG contents yields the following: G/C content = 0.64, observed/expected for CpG = 0.85 for ARF and G/C content = 0.54, observed/expected for CpG = 0.68 for INK4a over approximately 2,400 bp. (B) Sequence of a portion of the ARF promoter region (GenBank accession no. AF082338). The previously mapped transcription start site (36) is indicated by a bent arrow above the italicized “G” and is defined here as position +1. The positions of several potential transcription factor binding sites are underlined, as is a region homologous to other known initiator elements (Inr). Potential E2F binding sites are denoted with a line above the sequence; (−) indicates that the consensus binding site is 5′ to 3′ on the bottom strand. Positions of restriction enzyme sites used in subsequent cloning steps for promoter deletion analysis are underlined, and their positions relative to the transcription start site are indicated. Downward arrows denote 5′ ends of deletion constructs generated by PCR. A subset of the repetitive elements described in the text (Alu and purine-pyrimidine [Pur-Pyr]) is also shown.

