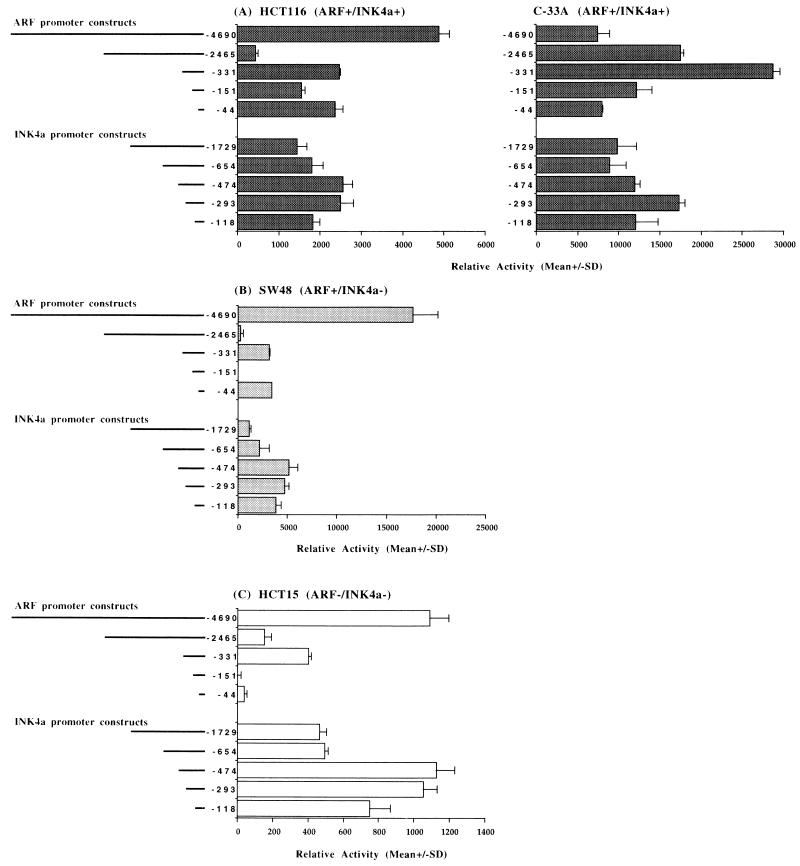
FIG. 6.
Comparison of activities of ARF and INK4a promoter-CAT constructs after transfection into ARF+ INK4a+ (A), ARF+ INK4a− (B), and ARF− INK4a− (C) cell lines. The map of each of the reporter constructs relative to the transcription start site of each promoter (for INK4a, the 5′-most initiation site was defined as +1) is indicated at the left and the mean relative activity (percent acetylation/β-galactosidase activity) for triplicate (duplicate for SW48 and HCT15) transfections is shown at the right. Error bars indicate the standard deviations (SD) from the means.

