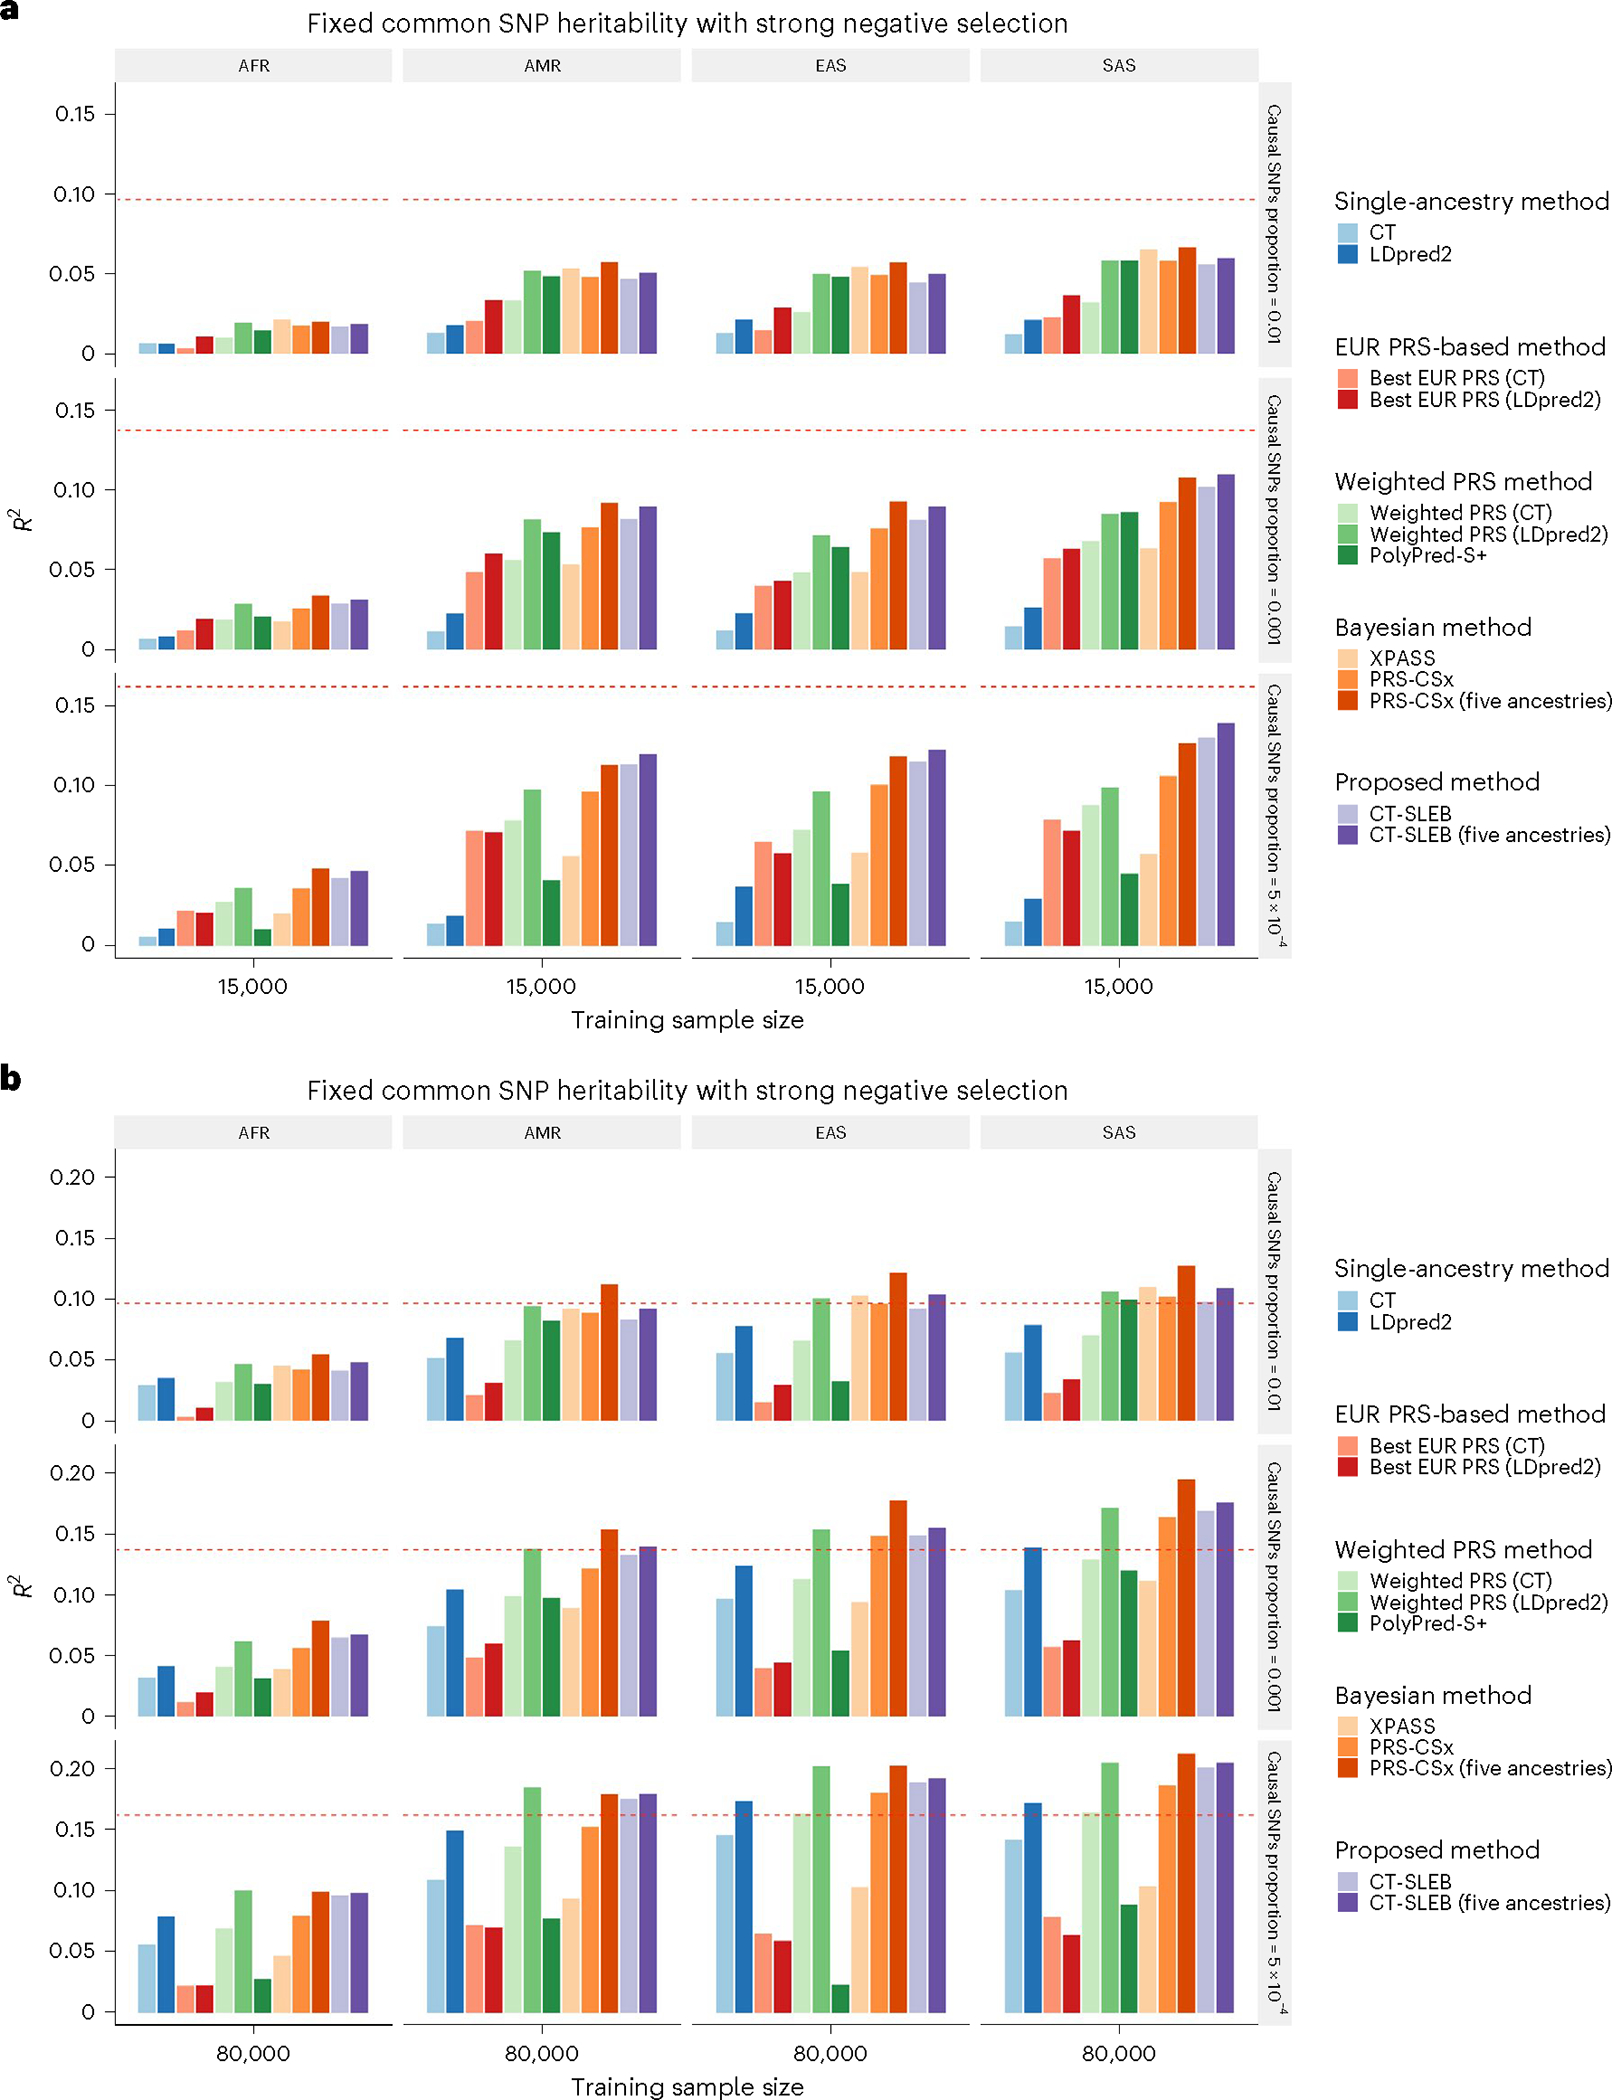
Fig. 2 |. Simulation results of various PRS methods in multiancestry settings.

a,b, Each of the four non-EUR populations with a training sample size of 15,000 (a) or 80,000 (b). For the EUR population, the size of the training sample was set at 100,000. The tuning dataset included 10,000 samples per population. Prediction R2 values were reported based on an independent validation dataset with 10,000 subjects per population. Common SNP heritability was assumed to be 0.4 across all populations, and effect-size correlation was assumed to be 0.8 across all pairs of populations. The proportion of causal SNPs varies across 0.01 (top), 0.001 (middle), 5 × 10⁻⁴ (bottom), and effect sizes for causal variants are assumed to be related to allele frequency, under a strong negative selection model. Data were generated based on ~19 million common SNPs across the 5 populations, but analyses were restricted to ~2.0 million SNPs that were used on Hapmap3 + MEGA chip array. PolyPred-S+ and PRS-CSx analyses were further restricted to ~1.3 million HM3 SNPs. All approaches were trained using data from the EUR and target populations. CT-SLEB and PRS-CSx were also evaluated using data from all five ancestries as training data. The red dashed line shows the prediction performance of EUR PRSs generated using the single-ancestry method (best of CT or LDpred2) in the EUR population.
