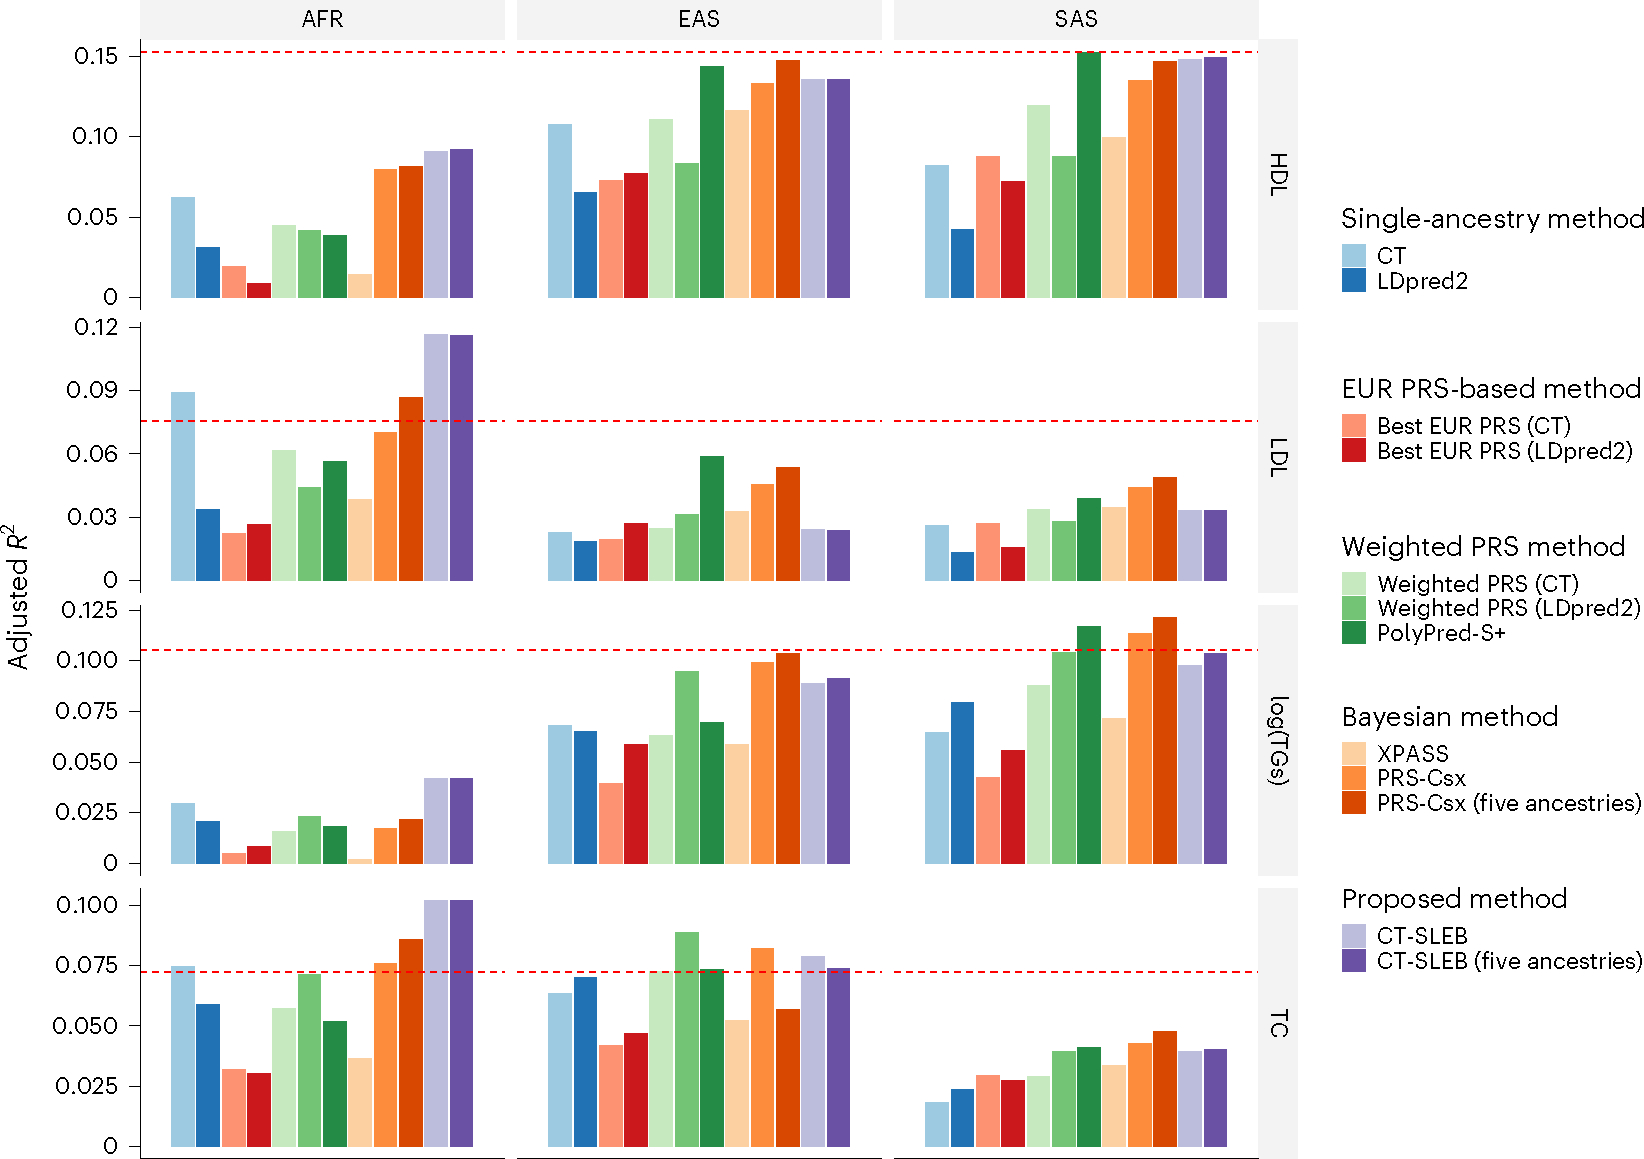
Fig. 7 |. Prediction accuracy of four blood lipid traits from the GLGC.

We used the GWAS summary statistics from five populations as the training data: EUR (n ≈ 931,000), AFR (primarily AA, n ≈ 93,000), Latino (n ≈ 50,000), EAS (n ≈ 146,000) and SAS (n ≈ 34,000). The tuning and validation datasets are from UKBB data with three different ancestries: AFR (n = 9,042), EAS (n = 2,009) and SAS (n = 10,615). The tuning and validation were split half and half. The adjusted R2 values were reported based on the performance of the PRS in the validation dataset, while accounting for PCs 1–10, sex and age. The red dashed line represents the prediction performance of EUR PRSs generated using a single-ancestry method (best of CT or LDpred2) in the EUR population. Analyses were restricted to ~2.0 million SNPs that are included in Hapmap3, the MEGA chips array or both. PolyPred-S+ and PRS-CSx analyses were further restricted to ~1.3 million HM3 SNPs as implemented in the provided software. All approaches were trained using data from the EUR and the target populations. CT-SLEB and PRS-CSx were also evaluated using training data from five ancestries. From top to bottom, four traits are displayed in the following order: (1) HDL-cholesterol, (2) LDL-cholesterol, (3) log(TGs) and (4) TC.
