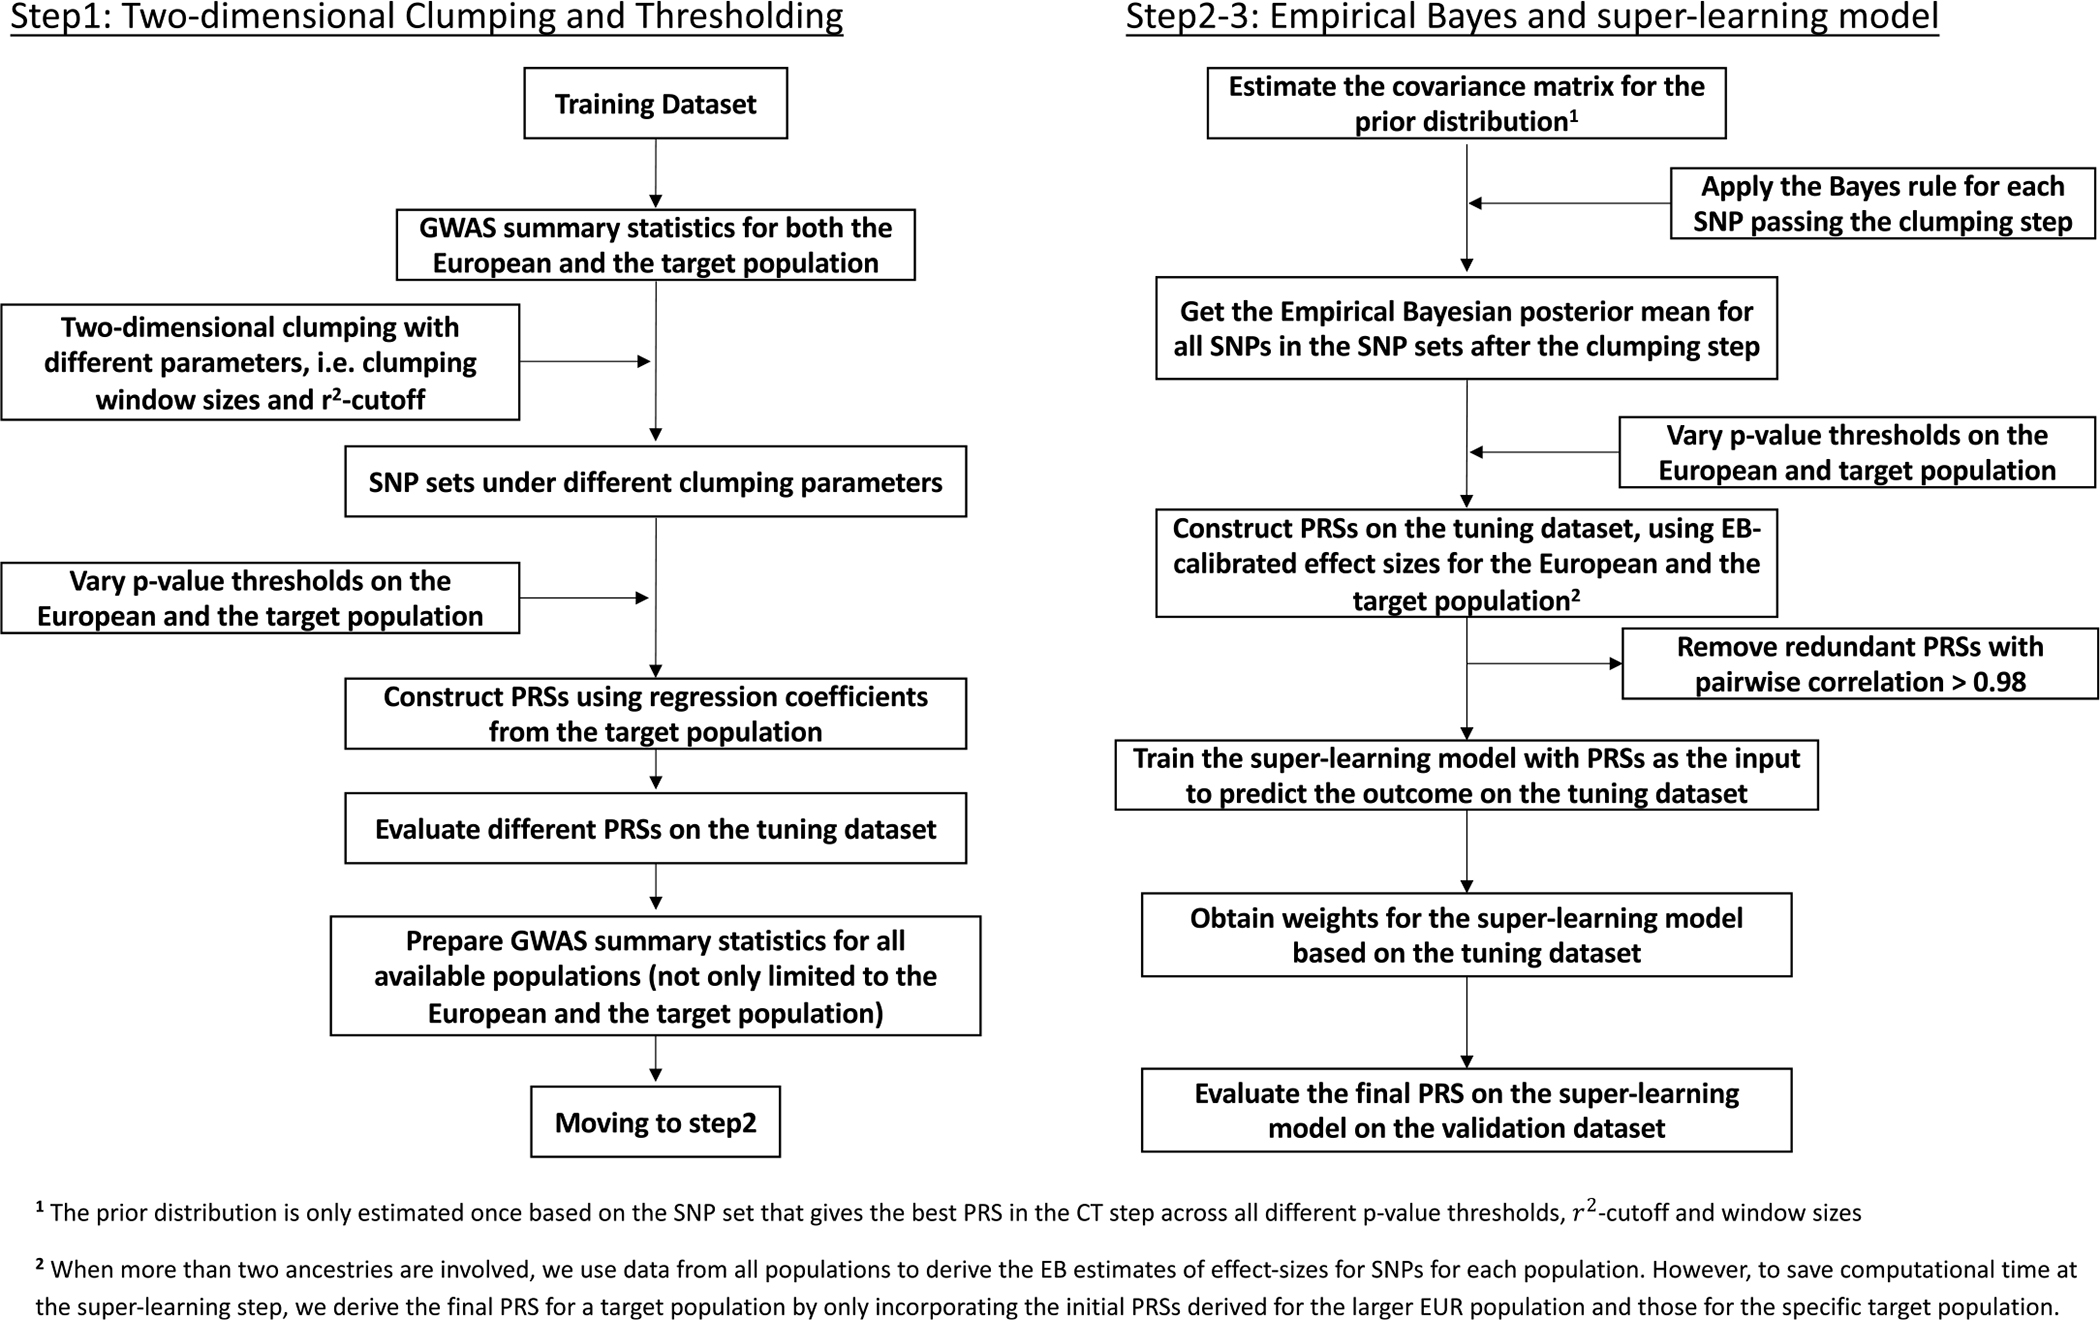
Extended Data Fig. 1 |. CT-SLEB detailed flowchart.

The method contains three major steps: 1. Two-dimensional clumping and thresholding; 2. Empirical-Bayes procedure for utilizing genetic correlations of effect sizes across populations; 3. Super-learning model for combining PRSs under different tuning parameters. The tuning dataset is used to train the super learning model. The final prediction performance is evaluated based on an independent validation dataset. For continuous traits, the prediction is evaluated using R2 obtained from the linear regression between outcome and PRS after adjusting for covariates (Methods). For binary traits, the prediction is evaluated using the area under the ROC curve (AUC).
