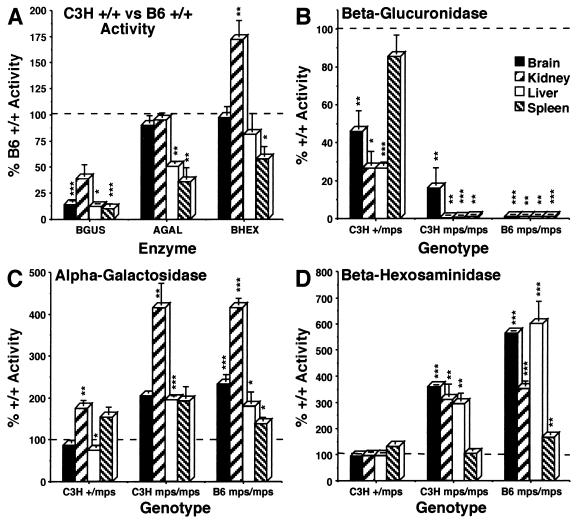
FIG. 3.
Lysosomal enzyme (β-glucuronidase [BGUS], α-galactosidase [AGAL], and β-hexosaminidase [BHEX]) levels for brain, kidney, liver, and spleen. In each graph, 100% normal activity is indicated by a horizontal bar. (A) Difference in basal enzyme activities between normal animals of the C3H (bars) and B6 (horizontal line) strains. The values for C3H +/+ animals were calculated by taking the B6 +/+ level as 100% activity. (B to D) Values for tissues from animals of the indicated genotype (y axis) were calculated by reference to the normal values from the strain of origin. C3H +/+ activity was defined as 100% in calculating the values for +/gusmps2J and gusmps2J/gusmps2J animals, and the B6 +/+ level was defined as 100% for the gusmps/gusmps animals; n = 5 for all genotypes and tissues assayed, except n = 4 for all +/+ animals. The levels of significance of P values calculated by using a two-tailed Student t test are indicated as follows: P ≤ 0.001, ∗∗∗; P ≤ 0.01, ∗∗; P ≤ 0.02 to 0.05, ∗; P > 0.05, no notation.

