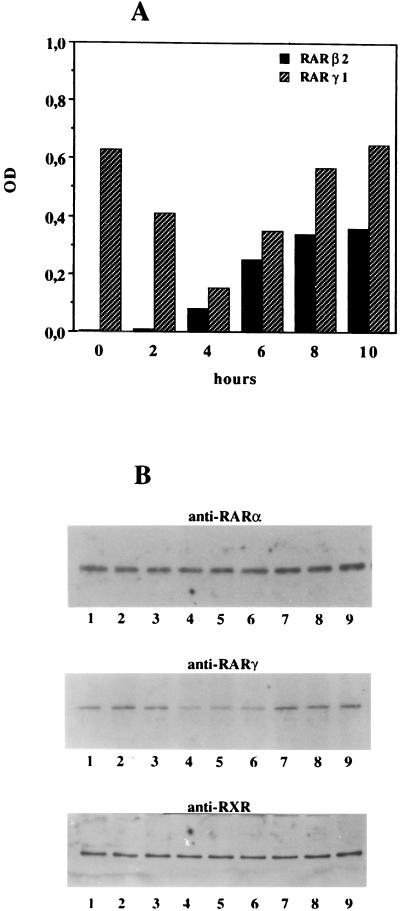
FIG. 2.
Time course of RA-regulated expression of RARβ2 and RARγ1. (A) SK-N-BE2(c) cells were plated at 106 cells per 25-cm2 tissue culture flask, and after an overnight incubation at 37°C, RA was added (time zero) to a final concentration of 10 nM. At various times after RA addition, total RNA was isolated and 1 μg was analyzed by RT-PCR for RAR or RXR expression as described in the text. Values for RAR and RXR mRNAs were normalized to that for β-actin mRNA used as internal standard for each RNA sample. The degree of amplification was quantitated by scanning densitometry and plotted as a ratio of RAR to β-actin or RXR to β-actin. Only data relative to RARβ2 and RARγ1 are reported, since no modulations were observed for the remaining RARs and RXRs. Five independent experiments with very similar results were conducted. OD, optical density. (B) Ten micrograms of DNA-binding proteins obtained from control cells and cells exposed to 10 nM RA was electrophoresed on SDS-polyacrylamide gels, transferred to PVDF membranes, and probed with antibodies against RARα, RARγ, or RXR. Lanes 1, control cells; lanes 2, cells exposed to RA for 90 min; lanes 3 to lane 9, treated cells collected every 30 min. Prestained molecular size standards were used to identify bands of the correct molecular weight.

