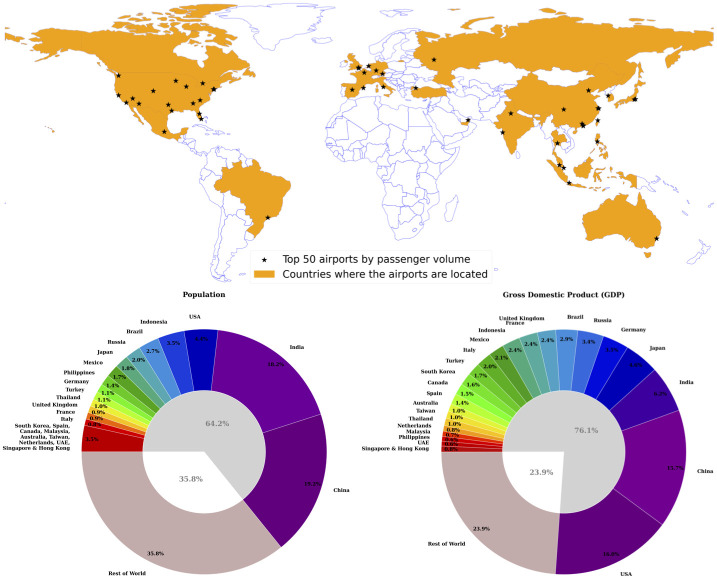
Fig 1. Top 50 busiest airports by passenger traffic in 2014 and their respective countries.
The pie charts show the countries’ population (left) and GDP (right) as fraction of the entire world. The world map showing countries’ boundary was generated using GeoPandas [47].

