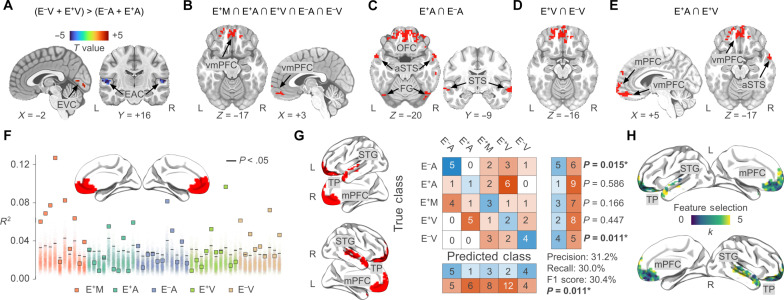
Fig. 4. Univariate and multivariate analyses of the emotion network and its association with sensory modality and experience.
(A) depicts regions encoding the emotion model as a function of sensory modality. In red, voxels showing higher fitting values in the visual modality, and in blue those specific for the auditory one. (B to E) summarize the results of conjunction analyses. Areas in red in (B) map the emotion model regardless of sensory experience and modality. In (C) and (D), we show the overlap between typically developed and sensory-deprived individuals presented with the auditory and the visual stimulus, respectively. (E) represents the convergence between voxels encoding affect in unisensory modalities in typically developed participants. (F) shows single-participant results of the association between emotion ratings and the average activity of vmPFC. Squares represent the fitting of the emotion model in each participant (typically developed multisensory, E+M: red; typically developed auditory, E+A: cyan; congenitally blind auditory, E−A: blue; typically developed visual, E+V: green; congenitally deaf visual, E−V: brown). Shaded areas refer to single-participant null distributions, solid black lines represent P value < 0.05. In (G), we show the results of multivoxel pattern classification analysis. Voxel-wise encoding R2 maps are used to predict sensory experience and stimulus modality. The central part of the panel shows the confusion matrix and the performance of the multiclass (n = 5; chance ~20%) cross-validated (k = 5) classifier. Classification performance is significantly different from chance (P value = 0.011) and driven by the successful identification of sensory-deprived individuals. Feature importance analysis (H) shows that voxels of vmPFC were rarely (or never) selected to predict sensory experience and modality. aSTS, anterior superior temporal sulcus; EVC, early visual cortex; EAC, early auditory cortex.

