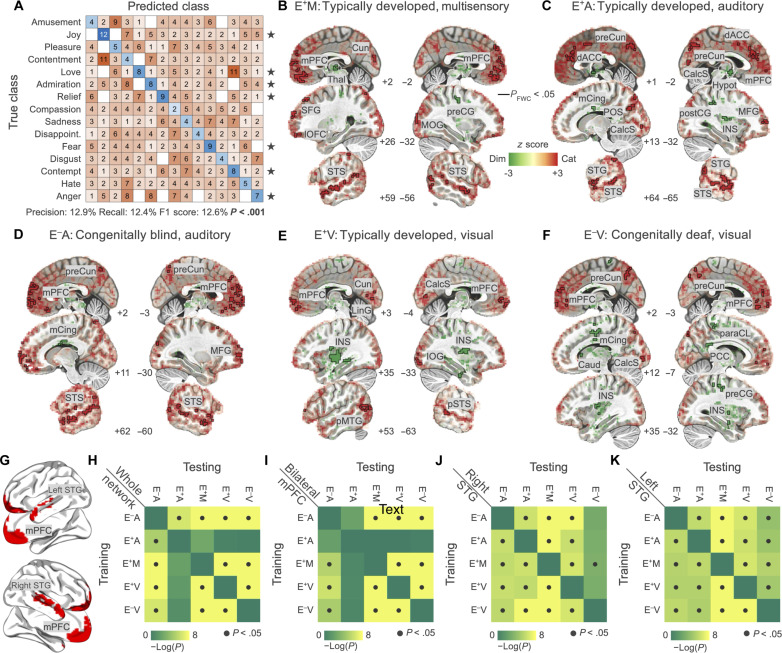
Fig. 5. Direct comparison between the categorical and dimensional encoding models and cross-decoding of emotion categories and valence ratings from brain activity.
In (A), results for the decoding of emotion categories from mPFC activity. Standardized fitting coefficients of the emotion model are used to train a classifier and predict left-out observations from one group and condition. Performance of the classifier is significantly different from chance (P value < 0.001; black stars indicate single-class significance). In (B to F), red indicates that brain activity is better explained by the categorical model while green by the dimensional one. The black outline identifies regions in which the comparison is significant (P valueFWC < 0.05). (G) depicts areas included in all cross-decoding procedures. In (H) to (K), we show the results of the cross-validated ridge regression aimed at predicting valence ratings from brain activity. We trained the algorithm on each group and condition and tested the association between brain activity and valence in all other groups and conditions. Results are summarized by the 5-by-5 matrices showing the significance of the prediction for each pairing (dark gray dots denote P value < 0.05). Cun, cuneus; Thal, thalamus; preCG, precentral gyrus; MOG, middle occipital gyrus; preCun, precuneus; dACC, dorsal anterior cingulate cortex; mCing, mid-cingulate cortex; POS, parieto-occipital sulcus; CalcS, calcarine sulcus; Caud, caudate nucleus; Hypot, hypothalamus; postCG, postcentral gyrus; MFG, middle frontal gyrus; INS, insula; LinG, lingual gyrus; pMTG, posterior middle temporal gyrus; paraCL, paracentral lobule; PCC, posterior cingulate cortex.

