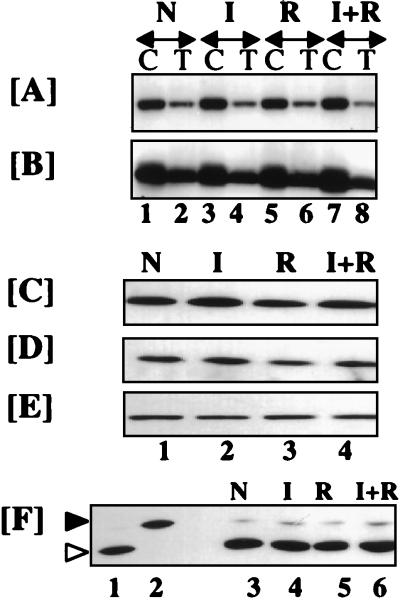
FIG. 3.
Activation of IFN-stimulated growth-inhibitory gene products does not occur during IFN-RA-induced cell death. (A) Binding of 32P-2,′5′-oligoadenylate to RNase L. (B) Western blot analysis of RNase L. Labels above the arrows: N, no treatment; I, IFN-β; R, RA; I+R, IFN-β plus RA. Labels below the arrows: C, cultured MCF-7; T, MCF-7 tumor xenograft in athymic nude mice. The following doses were used: in vitro, RA (1 μM) and IFN-β (500 U/ml) for 5 days; in vivo, RA (300 μg, oral) and IFN-β (106 U, subcutaneous) every day for 40 days. Cell or tumor extracts (70 μg) were assayed for various proteins. (C to E) Western blot analyses of MCF-7 lysates (50 μg) with specific antibodies: anti-PKR (C), anti-eIF-2α (D), and anti-actin (E). (F) PKR activity as measured by phosphorylation of eIF-2α. Lanes 1 and 2 represent PKR activity in the untreated and hemin- and double-stranded dsRNA-treated reticulocyte lysates (50 μg), respectively. Lanes 3 to 6 show PKR activity in MCF-7 lysates (50 μg) after treatment with various agents in vitro. After vertical slab gel isoelectric focusing, the gels were Western blotted and probed with anti-eIF-2α-specific antibodies. The positions of phosphorylated and unphosphorylated eIF-2α are indicated by solid and open arrowheads, respectively. The labels above panels C to F are as explained above for panel A.

