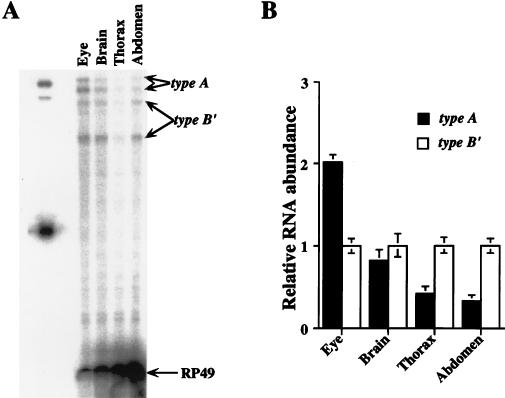
FIG. 5.
Tissue distribution of type A and type B′ transcripts. (A) RNase protection assays were performed with probe 3 (Fig. 1) on total RNA samples prepared from dissected eyes, eyeless heads (brain), thoraxes, and abdomens of CS flies collected at ZT15. The amounts of total RNA used for the samples were 5 μg (eye), 10 μg (brain), 20 μg (thorax), and 30 μg (abdomen). type A, the protected type A per transcript which is split into 254- and 235-nt bands because of a DNA polymorphism in the alternative intron within the per 3′UTR (see Materials and Methods); type B′, the two protected type B′ bands which are 220 and 183 nt; RP49, protected ribosomal protein 49 band. Similar results were obtained from three independent experiments. The lower protected type A band overlaps with a nonspecific band from the probe itself. (B) Ratios of type A and type B′ transcripts in different tissues (see Materials and Methods for transcript quantitation). For a given tissue, the abundance of type A transcript is compared to that of type B′ transcripts, which are normalized to 1.

