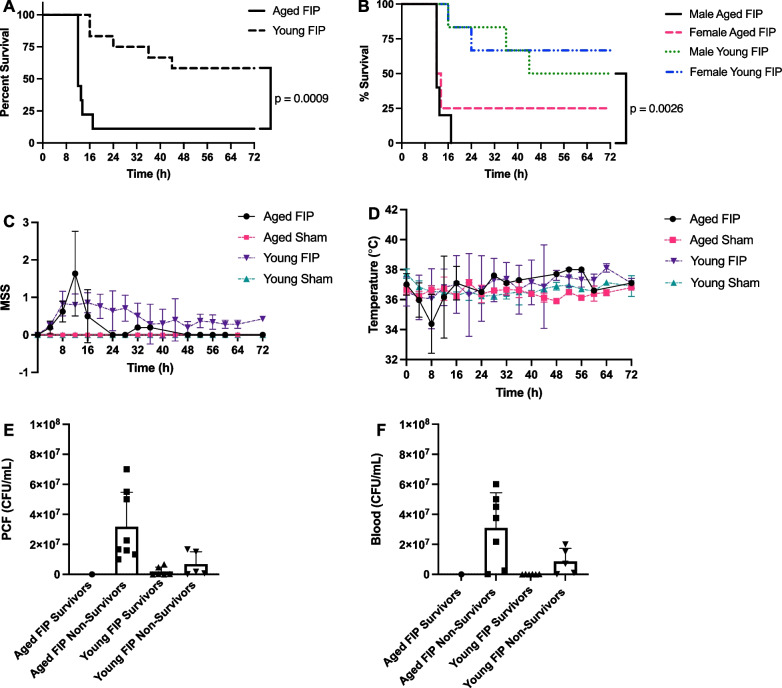
Fig. 4.
Effects of age on mortality, MSS, and body temperature in a 72 h FIP model of sepsis. Kaplan–Meier survival curves (A and B), MSS (C), and body temperature (D) over time in aged and young FIP mice. Mice that survived till experimental endpoint are designated as survivors. Mice that were humanely euthanized according to their MSS are designated as non-survivors. Aged FIP (n = 9), young FIP (n = 12), aged sham (n = 3), and young sham (n = 3). Data are presented as mean ± SD. Survival curves were analyzed using a Log-rank (Mantel-Cox) test. Bacterial loads were analyzed using a one-way ANOVA. P-values < 0.05 were considered significant. Bacterial loads for PCF (E) and blood (F) in aged and young FIP survivors and non-survivors. (Note: For 1 aged FIP non-survivor, unable to collect blood and for 1 young FIP survivor, blood and PCF colonies were too confluent to count).

