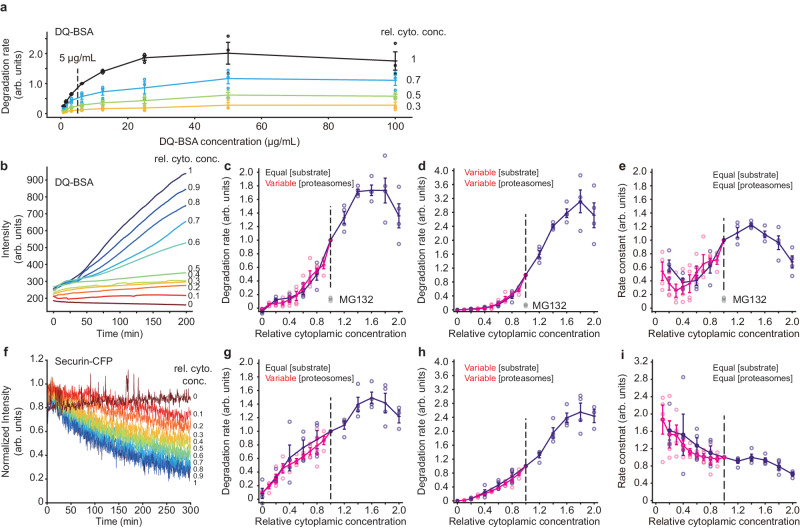
Fig. 3. The rate of protein degradation is maximal at cytoplasmic concentrations of~1.8×.
a Titration of substrate protein concentration for DQ-BSA degradation experiments. The indicated concentration (5 µg/mL) was chosen for the experiments in (b–e). Data from n = 3 independent experiments. Data are presented as mean values ± SEM. b DQ-BSA fluorescence as a function of time for various dilutions of a 1× extract. c Degradation rate as a function of cytoplasmic concentration. These are the directly-measured data from experiments where the DQ-BSA concentration was kept constant and the proteolysis machinery was proportional to the cytoplasmic concentration. The gray data points denoted MG132 are from 1× extracts treated with 200 µM MG132, a proteasome inhibitor. Data are from 4 experiments for dilution from 1× extracts and 4 experiments for dilution from 2× retentates. Data are normalized relative to the degradation rates at a cytoplasmic concentration of 1×. Means and standard errors are overlaid on the individual data points. In this and the subsequent panels, the darker purple represents data from diluting 2× retentates and the lighter purple from diluting 1× extract. d Inferred degradation rates for the situation where the substrate concentration as well as the proteasome concentration is proportional to the cytoplasmic concentration. The rates from (c) were multiplied by the relative cytoplasmic concentrations. Data are from n = 4 independent experiments for dilution from 1× extracts and n = 4 independent experiments for dilution from 2× retentates. Data are presented as mean values ± SEM. e Inferred degradation rates for the situation where both the substrate concentration and the proteasome concentration are kept constant at all dilutions. The rates from (c) were divided by the relative cytoplasmic concentrations. This represents an estimate of the apparent bimolecular rate constant for degradation. Data are from n = 4 independent experiments for dilution from 1× extracts and n = 4 independent experiments for dilution from 2× retentates. Data are presented as mean values ± SEM. f Degradation of securin-CFP as a function of time for various dilutions of a 1x extract. g Degradation rate as a function of cytoplasmic concentration. These are the directly-measured data from experiments where the securin-CFP concentration was kept constant but the proteasome concentration was proportional to the cytoplasmic concentration. Data are from 4 experiments for dilution from 1× extracts and 4 experiments for dilution from 2× retentates. Data are normalized relative to the degradation rates at a cytoplasmic concentration of 1×. Means and standard errors are overlaid on the individual data points. h Inferred degradation rate for the situation where both the substrate and proteasome concentrations are proportional to the cytoplasmic concentration. The rates from (g) were multiplied by the relative cytoplasmic concentrations. Data are from n = 4 independent experiments for dilution from 1× extracts and n = 4 independent experiments for dilution from 2× retentates. Data are presented as mean values ± SEM. i Inferred degradation rates for the situation where both the substrate and the proteasome concentration are kept constant at all dilutions. The rates from (g) were divided by the relative cytoplasmic concentrations. Data are from n = 4 independent experiments for dilution from 1× extracts and n = 4 independent experiments for dilution from 2× retentates. Data are presented as mean values ± SEM. Source data for panels (a, d, and h) are provided as a Source Data file.

