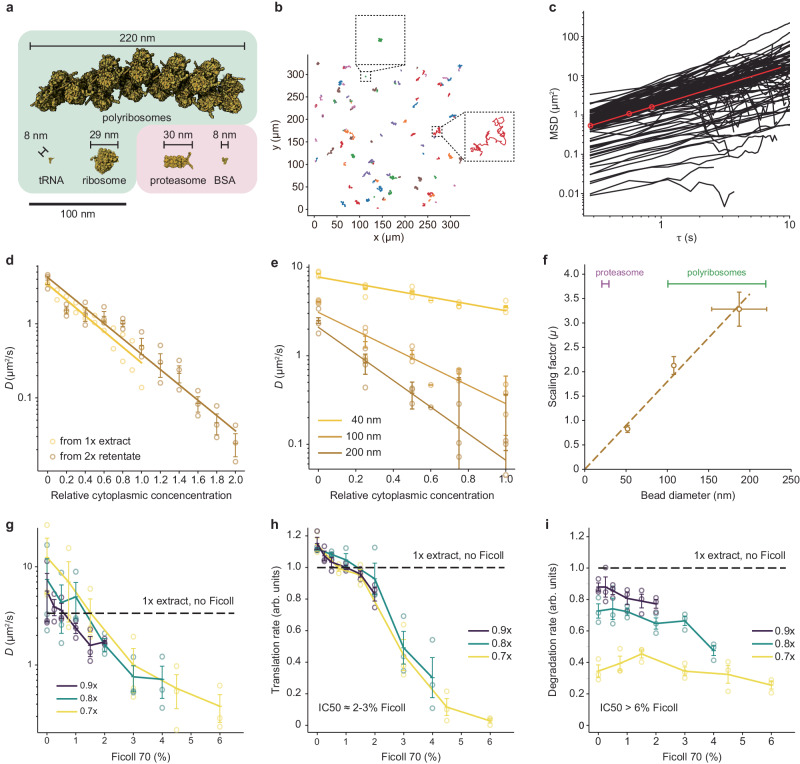
Fig. 4. The effect of cytoplasmic concentration on diffusion, and the effect of Ficoll 70 on translation and protein degradation.
a The sizes of various macromolecules and complexes involved in translation and degradation. b Single particle traces for diffusion of 100 nm fluorescent beads in 1× cytoplasmic extracts. Two examples of location-to-location variability are highlighted. c Mean squared displacement for 110 individual trajectories (black) and average mean squared displacement (red) as a function of the time difference τ. Effective diffusion coefficients were calculated from the first 1 s of data. d Effective diffusion coefficients for 100 nm fluorescent beads as function of relative cytoplasmic concentration. Data are from 3 experiments for the 2× extract dilution and from 2 experiments for the 1× extract dilution. Error bars for the 2× extract dilution represent means ± standards errors. e Effective diffusion coefficients for beads of different diameter (nominally 40 nm, 100 nm, and 200 nm) as a function of relative cytoplasmic concentration. Data are from 3 experiments. Means and standard errors are overlaid on the individual data points. f The scaling factor μ (from Eq. 1) as a function of bead diameter. The apparent bead diameters (nominally 40, 100, and 200 nm) were calculated from their diffusion coefficients in extract buffer with no sucrose using the Stokes-Einstein relationship. Scaling factors are from 3 experiments and are shown as means ± S.E. Bead diameters are from 3 experiments for the 40 nm beads and 4 experiments for the 100 and 200 nm beads, and again are plotted as means ± S.E. The diameters of proteasomes and polyribosomes are shown for comparison. g Diffusion coefficients of 40 nm beads as a function of Ficoll 70 concentration. Extracts were prepared at 0.7×, 0.8×, and 0.9× as indicated and supplemented with Ficoll to yield the final concentrations (w/vol) shown on the x-axis. Data are from 3 experiments. Means and standard errors are overlaid on the individual data points. Diffusion coefficients for the undiluted 1× extracts were also measured and the average is shown for reference. h Translation rates, using the eGFP assay, as a function of Ficoll 70 concentration. Extracts were prepared at 0.7×, 0.8×, and 0.9× as indicated and supplemented with Ficoll to yield the final concentrations (w/vol) shown on the x-axis. Data are from the same 3 experiments shown in (g). Means and standard errors are overlaid on the individual data points. Translation rates for the undiluted 1× extracts were also measured and the average is shown for reference. i Degradation rates, using the DQ-BSA assay, as a function of Ficoll 70 concentration. Extracts were prepared at 0.7×, 0.8×, and 0.9× as indicated and supplemented with Ficoll to yield the final concentrations (w/vol) shown on the x-axis. Data are from the same 3 experiments shown in (g). Means and standard errors are overlaid on the individual data points. Degradation rates for the undiluted 1× extracts were also measured and the average is shown for reference. Source data for panels (d–i) are provided as a Source Data file.

