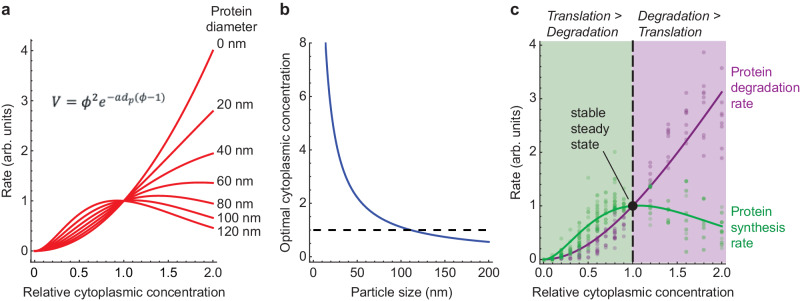
Fig. 5. Homeostasis in a model of the effect of cytoplasmic concentration of translation and protein degradation.
a Plot of Eq. 2, which relates a bimolecular reaction rate to the relative cytoplasmic concentration, for various sizes of proteins. We assumed a = 0.018 nm-1 (from Fig. 4f). b Calculated optimal relative cytoplasmic concentration for proteins of different assumed sizes, again assuming a = 0.018 nm-1. c Fits of Eq. 2 to the experimental data for translation (green) and degradation (purple) as a function of cytoplasmic concentration, calculated assuming that both the substrate and enzyme varied with the cytoplasmic concentration. All of the data from Figs. 2d, h, and 3d, h were included in the fits. The values are 0.92 for the translation data and 0.95 for the degradation data. The fitted values for the size of the proteins involved are 104 ± 2 nm (mean ± S.E.) for translation and 14 ± 1 nm (mean ± S.E) for degradation. The fitted optimal cytoplasmic concentrations are 1.07 ± 0.02 for translation and 8.1 ± 0.8 for degradation (mean ± S.E.).

