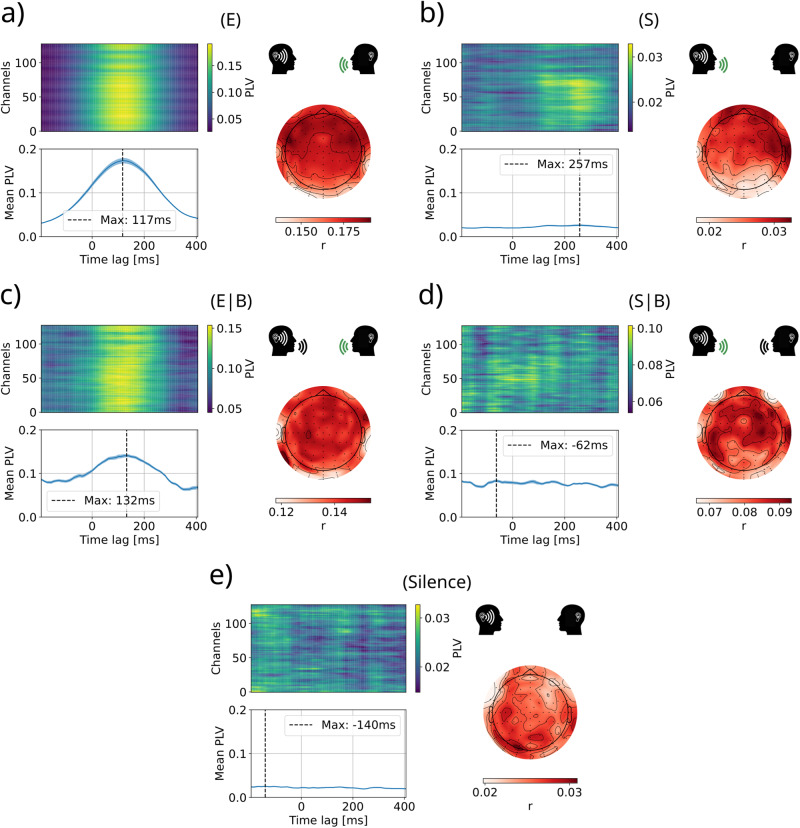
Fig. 6. Phase-locking value (PLV) between the EEG signal of each electrode and the envelope signal, averaged across participants for all dialog conditions.
a Listening to external speech (E); b Listening to self-produced speech (S); c Listening to the external speech while both are speaking (E∣B); d Listening to the self-produced speech while both are speaking (S∣B); e Silence. Each panel shows the phase synchronization between each EEG channel and the envelope feature (top left), and the average values and standard deviation across channels (bottom left), for all time-lags between −200 ms and 400 ms. The time lag 0 corresponds to the EEG and envelope from matching instants, negative latencies indicate that the EEG signal precedes the auditory signal (making it impossible to have a causal effect), while positive lags indicate that the brain activity follows the auditory signal. On the right side of every panel, the topographic distribution of phase-locking values for the time lag of maximum average synchronization.

