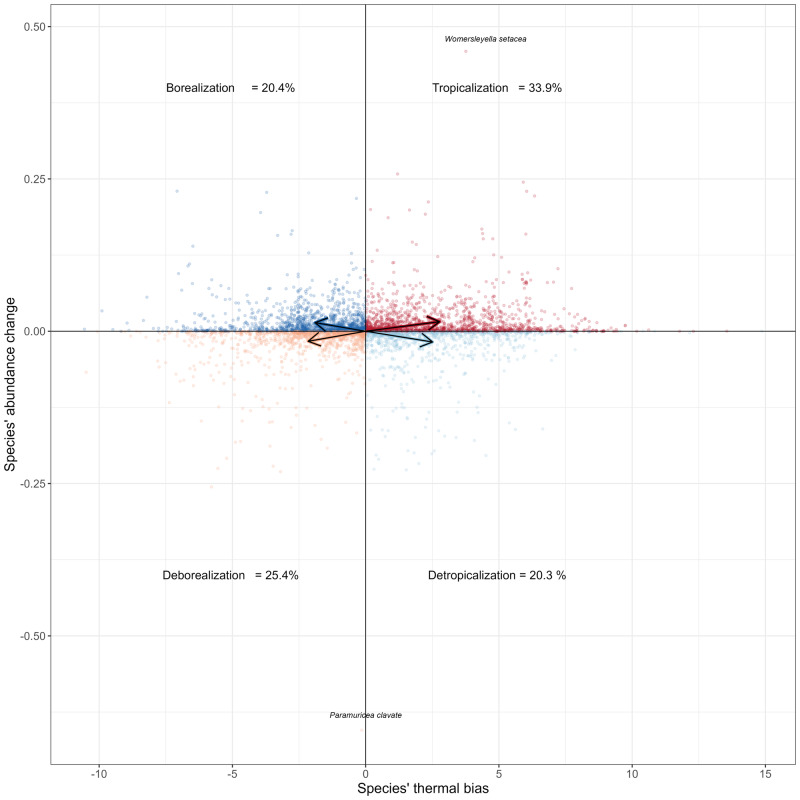
Fig. 4. Species’ abundance change against species’ thermal bias (species thermal preference - CTI) for all case studies sites.
Arrows represent the mean value of Species’ thermal bias with respect to Species’ abundance change for each underlying process (i.e. tropicalization, borealization, detropicalization, deborealization). Extreme values in Species’ abundance change are represented by tropicalization in the tropical red alga Womersleyella setacea and deborealization of the temperate-water species of gorgonian Paramuricea clavate (see species’ names labels), both in the coastal hard-bottom coralligenous communities in the Western Mediterranean.

