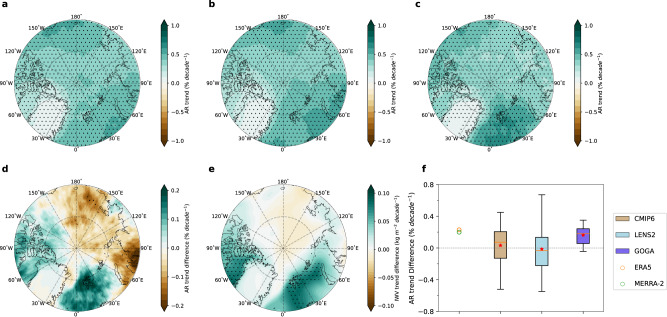
Fig. 2. Simulated Arctic atmospheric river (AR) trends during 1981-2021.
a Ensemble mean trend in the Arctic AR frequency simulated in LENS2. b Ensemble mean Arctic AR frequency trend in LENS2 due to thermodynamical changes. c Ensemble mean Arctic AR frequency trend in GOGA. d Difference between the ensemble mean AR frequency trends in GOGA and LENS2 (GOGA – LENS2). e Same as (d) but for the column-integrated water vapor (IWV). The stippled areas in (a), (b), (c), (d), and (e) indicate trends or differences that are significant at the 0.05 level based on the Student’s t-test. f, Trend differences between the Atlantic sector (red box in Fig. 1a) and Pacific sector (magenta box in Fig. 1a) in reanalyses (circles) and simulations (bars and whiskers). The orange lines (red stars) in (f) represent the ensemble median (mean). The boxes represent the 25th–75th percentile range of the spread. The whiskers denote the maximum and minimum of the spread.

