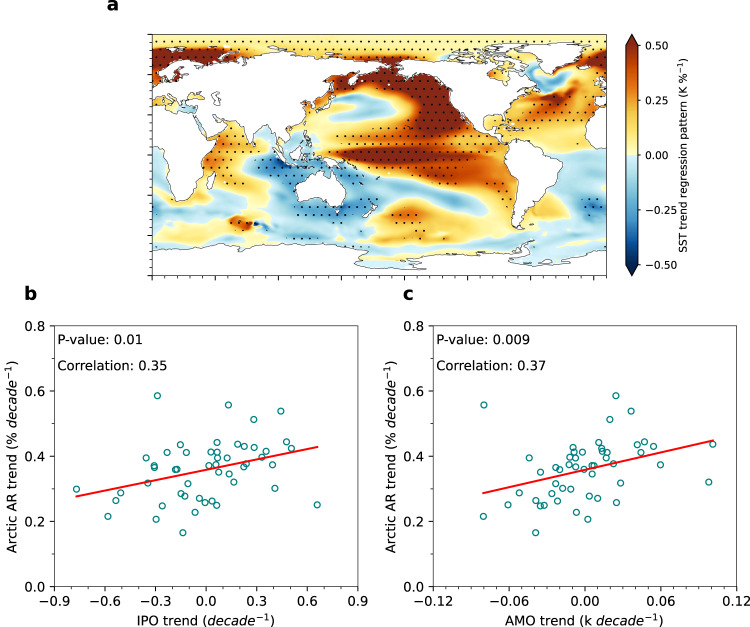
Fig. 4. Relationship between the Arctic spatial mean atmospheric river (AR) frequency trends and the Interdecadal Pacific Oscillation (IPO)/Atlantic Multidecadal Oscillation (AMO).
a LENS2 intermember regression of the sea surface temperature (SST) trends onto the Arctic spatial mean AR frequency trends. The regression pattern is obtained by regressing the SST trends at each grid point across all 50 members onto the spatially averaged Arctic AR frequency trends across all 50 members. Stippled areas indicate that the regression is significant at the 0.05 level based on the Student’s t-test. b shows scatterplots between the Arctic mean AR frequency trends and the IPO trends, where the red lines show the regression of data points for 50 members of LENS2. c same as in (b), but for the AR trends and AMO trends.

