Figure 2.
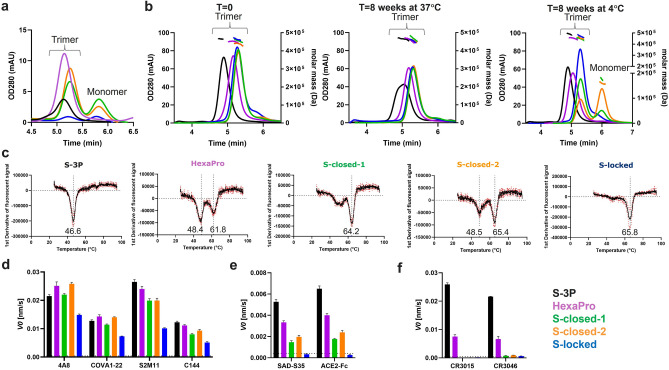
Expression and characterization of differently stabilized purified S proteins. (A) Analytical SEC on supernatants, reflecting trimer expression levels. (B) SEC profile of purified proteins at t = 0 (left panel), t = 8 weeks at 37 °C (middle panel) and t = 8 weeks at 4 °C (right panel). The molar mass traces determined by MALS signals are shown above the SEC curves. See Table S1 for theoretical and calculated MW and radiï. (C) First derivatives of fluorescent signals measured with differential scanning fluorimetry (DSF) with the black curve showing the average of a technical triplicate. The average of three values of calculated melting temperatures in °C are shown below the valleys in the curves. (D) Biolayer Interferometry (BLI) showing the initial slope V0 at the start of binding with neutralizing antibodies 4A8, COVA1-22 that bind to the NTD, and S2M11 and C144 that bind to the RBD irrespective of its position (up or down). (E) BLI with SAD-S35 and the ACE2 receptor that bind to the RBD when it is in the up position. (F) BLI with non-neutralizing antibodies CR3015 and CR3046 that bind epitopes in S2 that are shielded in the prefusion conformation. (D–F) Bars are plotted as average + SD (n = 3 technical replicates). The lower limit of detection (LLOD) is indicated with a horizontal dotted line. (A,B,D–F) Line and bar colors correspond to S protein legend in the lower right panel.

