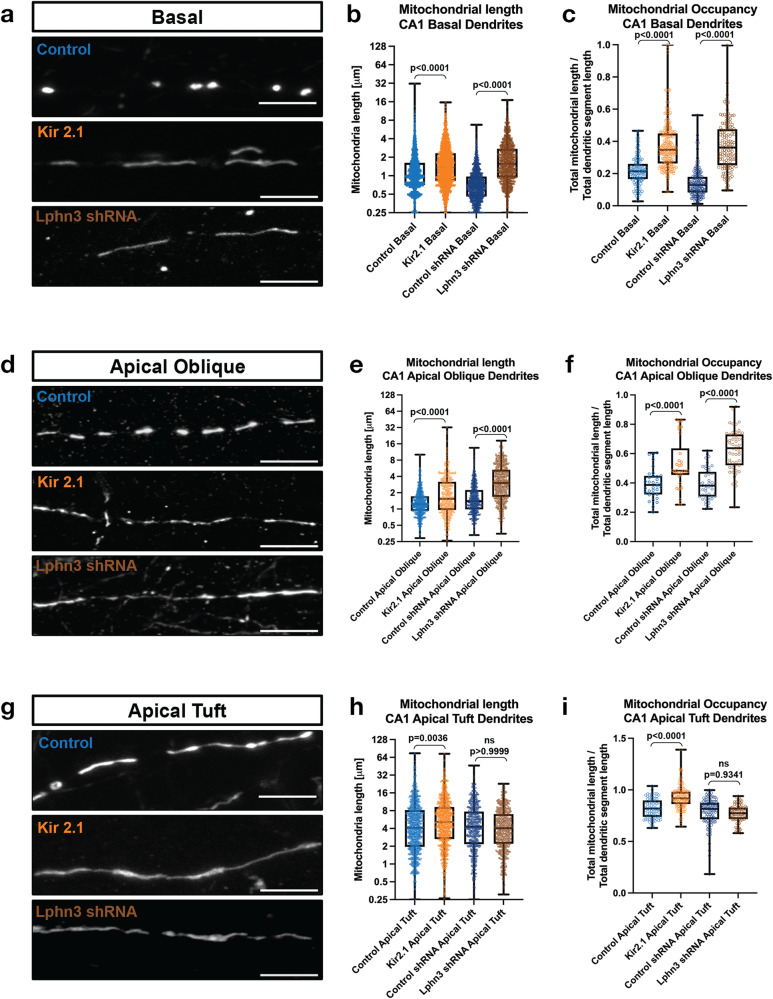
Fig. 3. Neuronal activity regulates mitochondrial size in a compartment specific manner in CA1 pyramidal neurons in vivo.
a–i High magnification representative images of mitochondrial morphology within isolated secondary or tertiary hippocampal CA1 (a) basal, (d) apical oblique, and (g) apical tuft dendrites in which a mitochondrial matrix-targeted fluorescent protein (mt-YFP) was IUE along with either a control plasmid (pCAG tdTomato) or pCAG Kir2.1-T2A-tdTomato), or either control shRNA or Lphn3 shRNA plasmid. Quantification of mitochondrial length and occupancy in the (b) and (c) basal, (e) and (f) apical oblique, and (h) and (i) apical tuft dendritic compartments following Kir2.1 over-expression or shRNA-mediated knockdown of Lphn3. Quantification of mitochondrial length (b), (e), and (h) and mitochondrial occupancy (c, f and i) in basal dendrites (b, c), apical oblique (e, f) and apical tuft (h, i) demonstrates that both Kir2.1 over-expression and Lphn3 knockdown significantly increases mitochondrial length and occupancy in basal (b, c) and apical oblique dendrites (e, f). ControltdTomato-basal = 127 segments, 2154 mitochondria, mean length = 1.42 µm ± 0.03 µm (SEM), mean occupancy = 21.8% ± 0.9% (SEM); ControltdTomato-apical oblique = 34 segments, 748 mitochondria, mean length = 1.49 µm ± 0.04 µm, mean occupancy = 39.4% ± 1.0%; ControltdTomato-apical tuft = 75 segments, 1036 mitochondria, mean length = 6.48 µm ± 0.23 µm, mean occupancy = 81.9% ± 1.1%; Kir2.1tdTomato-basal = 206 segments, 2278 mitochondria, mean length = 1.87 µm ± 0.03 µm, mean occupancy = 37.8% ± 1.0%; Kir2.1tdTomato-apical oblique = 30 segments, 435 mitochondria, mean length = 2.54 µm ± 0.14 µm, mean occupancy = 53.5% ± 2.9%; Kir2.1tdTomato-apical tuft = 128 segments, 965 mitochondria, mean length = 7.19 µm ± 0.22 µm, mean occupancy = 92.7% ± 1.0%; ControlshRNA-basal = 169 segments, 1344 mitochondria, mean length = 0.81 µm ± 0.01 µm, mean occupancy = 13.8% ± 0.6%; ControlshRNA-apical oblique = 45 segments, 633 mitochondria, mean length = 1.84 µm ± 0.05 µm, mean occupancy = 39% ± 1.6%; ControlshRNA-apical tuft = 106 segments, 617 mitochondria, mean length = 5.81 µm ± 0.20 µm, mean occupancy = 78.6% ± 1.2%; Lphn3shRNA-basal = 129 segments, 1169 mitochondria, mean length = 2.11 µm ± 0.04 µm, mean occupancy = 37.4% ± 1.3%; Lphn3shRNA-apical oblique = 53 segments, 573 mitochondria, mean length = 3.92 µm ± 0.12 µm, mean occupancy = 62.5% ± 1.9%; Lphn3shRNA-apical tuft = 84 segments, 561 mitochondria, mean length = 5.1 µm ± 0.16 µm, mean occupancy = 75.2% ± 0.9%. p values are indicated in the figure following a Kruskal-Wallis test. Data are shown as individual points on box plots with 25th, 50th and 75th percentiles indicated with whiskers indicating min and max values. Scale bar, 5 μm.

