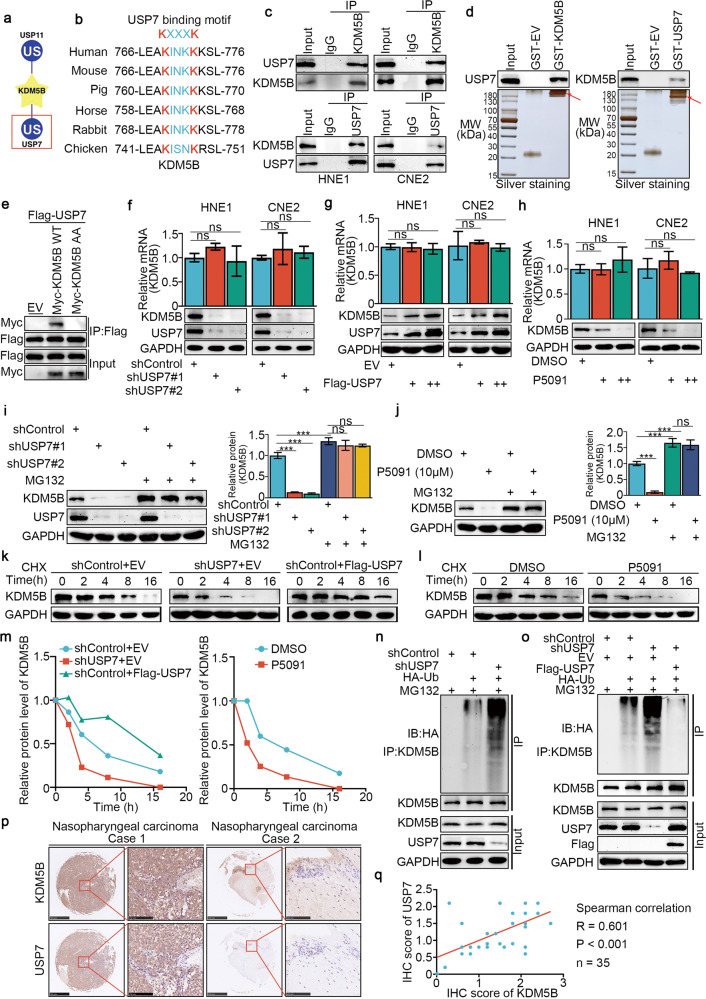
Fig. 6. USP7 promoted the stability of the KDM5B protein in NPC by deubiquitinating KDM5B.
a UbiBrowser showed deubiquitinationases (DUBs) that might interact with KDM5B. b A schematic diagram depicted that the USP7 deubiquitination consensus motif of KDM5B. c HNE1 and CNE2 cells were harvested and immunoprecipitated with IgG and USP7 or KDM5B antibodies. d Western blot analysis for USP7 and KDM5B in HNE1 cells after GST, GST-KDM5B or GST-CBX7 pulldown. The bottom panel shows the Silver staining of GST, GST-KDM5B or GST-CBX7 protein input. e HEK293T cells were transfected with the indicated plasmids and harvested 48 h after transfection. Co-IP experiments were performed and blotted with the indicated antibodies. f, g HNE1 and CNE2 cell lines were infected with constructed plasmids (shUSP7 #1, shUSP7 #2, Flag-USP7). After infecting 48 h and 72 h, all cells were harvested for RT-qPCR and Western Blotting analysis. All data were showed as Means ± SD (n = 3). Ns not significant. h HNE1 and CNE2 cell lines were treated with or without USP7 inhibitors P5091 (10 μM) for 48 h. Then cells were harvested for RT-qPCR and Western Blotting analysis. All data were showed as Means ± SD (n = 3). Ns not significant. i, j HNE1 and CNE2 cell lines were infected with constructed plasmids (shUSP7 #1, shUSP7 #2). After infecting 48 h and 72 h, the corresponding groups were treated with MG132 for another 4 h. All cells were harvested for Western Blotting analysis. k HNE1 cells were infected with indicated plasmids (shUSP7 and Flag-USP7). After infecting 72 h, cells were treated with Cycloheximide (CHX) and all cells were collected for Western Blotting analysis at different time points. l HNE1 cells were treated with or without USP7 inhibitors P5091 (10 μM) for 48 h. Cells were treated with MG132 for another 4 h. Then all cells were collected for Western Blotting analysis. m Statistical line chart of half-life of KDM5B protein. n HNE1 cells were infected with indicated plasmids (shUSP7, HA- Ub). After 24 h, cells were treated with MG132 for 4 h. Then all cells were collected for Western Blotting analysis. o HNE1 cells were treated with indicated plasmids (shUSP7, Flag-USP7, HA-Ub) for 24 h. Then cells were treated with MG132 for 4 h. All cells were collected for Western Blotting analysis. p, q The tissue microarray of NPC was stained with USP7 and KDM5B, respectively (n = 35). The typical IHC images stained with USP7 and KDM5B were shown in panel (p). The size of the scale bar on microscopy images as indicated in the figure. The correlation of these two proteins was shown in panel (q). Spearman correlation was used to determine statistical significance, P < 0.001.

