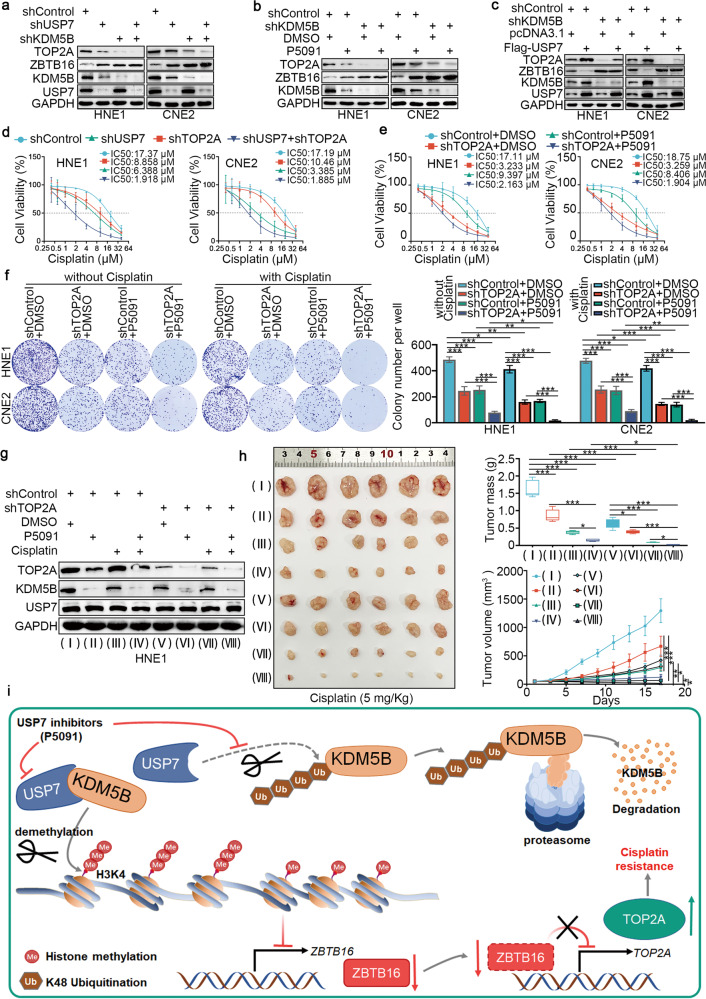
Fig. 7. The USP7/KDM5B/ZBTB16/TOP2A axis modulates cisplatin resistance in NPC cells.
a–c HNE1 and CNE2 cell lines were infected with constructed plasmids (shUSP7, shKDM5B, Flag-USP7). Cells were treated with USP7 inhibitors P5091 (10 μM) in (b). After infecting or treating 72 h, all cells were harvested for Western Blotting analysis. d HNE1 and CNE2 cells were infected with indicated shRNAs for 72 h. Cells were treated with a serial dose of cisplatin. Then, these cells were collected for CCK-8 assay and subjected to measure the IC50 values of cisplatin. e HNE1 and CNE2 cells were infected with shControl or shTOP2A plasmid for 48 h. Then cells were treated with USP7 inhibitors P5091 (10 μM) in a serial dose of cisplatin. Then, these cells were collected for CCK-8 assay and subjected to measure the IC50 values of cisplatin. f HNE1 and CNE2 cells were infected with shControl or shTOP2A plasmid for 48 h. Then cells were treated with USP7 inhibitors P5091 (10 μM) for colony-formation assay in the presence or absence of cisplatin. Statistical significance was determined by one-way ANOVA followed by Tukey’s multiple comparisons test. Data presented as Mean ± SD with three replicates. *P < 0.05; **P < 0.01; ***P < 0.001. g, h HNE1 cells were infected with indicated shRNAs for 72 h. After puromycin selection, cells were harvested for western blot analysis (g) and subcutaneously injected into the nude mice. The western blot analysis was repeated for three replicates. The mice were treated with or without cisplatin (5 mg·kg−1·day−1, 10 days) or USP7 inhibitors (10 mg·kg−1, twice a week). Representative tumor images, tumor weights, and tumor growth curves are shown. Data are shown as mean ± SD (n = 6). Statistical analyses were performed with one‐way ANOVA followed by Tukey’s multiple comparisons tests. Ns not significant; *P < 0.05; ***P < 0.001. The ruler on the top of the representative tumor images on panel h was used to indicate the specific size of tumors. i The schematic diagram for USP7 stabilizing KDM5B to inhibit the expression of ZBTB16, which subsequently increased the expression of TOP2A and promoted NPC cell proliferation and resistance to cisplatin.

