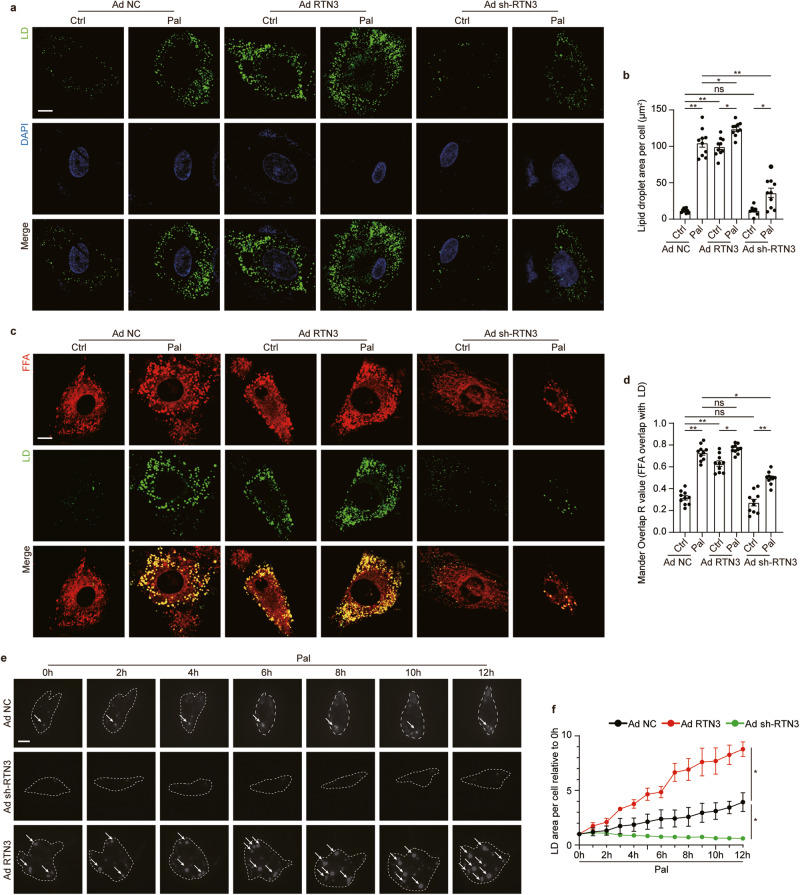
Fig. 4. RTN3 was sufficient to induce LD biogenesis in cardiomyocytes.
Representative fluorescence images indicating LDs labeled with Bodipy 493/503 and nucleus labeled with DAPI (a) and quantitative analysis of LDs area per cell (b) (n = 10 images each group), scale bar = 10 μm; Representative fluorescence images indicating FFA labeled with Bodipy 558/568 C12 and LDs labeled with Bodipy 493/503 (c) and quantitative analysis of localization of FFA with LDs quantified with Mandar overlap R value analysis (d) (n = 10 images each group), scale bar = 10 μm; e Time-lapse montage of LDs biogenesis in live cells, scale bar = 10 mm; f Quantitative analysis of LD area (n = 10 images each group). Data are expressed as Mean ± SEM. Differences are significant for *P < 0.05, **P < 0.01.

