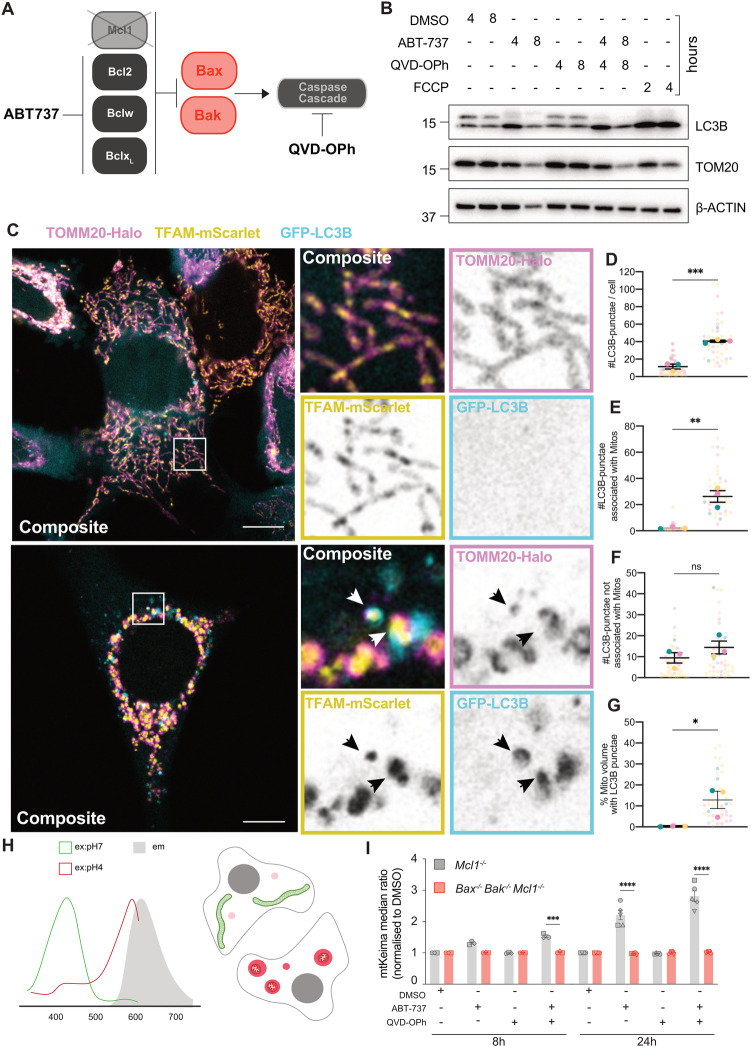
Fig. 1. Mitophagy occurs during apoptosis.
A Schematic of experimental model of intrinsic apoptosis induction, utilising Mcl1−/− MEFs treated with the BH3 mimetic ABT-737, with or without the pan-caspase inhibitor QVD-OPh. B Mcl1−/− MEFs were treated with ABT-737 [1 µM] ± QVD-OPh [20 µM], FCCP [30 µM], or DMSO vehicle control for indicated times and assessed by immunoblot for TOMM20, LC3B, and β-ACTIN as a loading control. Representative of n = 4 independent experiments. C Mcl1−/− MEFs expressing TOMM20-Halo (stained with JF646, pink), TFAM-mScarlet (yellow), and GFP-LC3B (cyan) were treated for 4 h with DMSO vehicle control or ABT-737 [1 µM] and QVD-OPh [20 µM] and imaged live by Airyscan confocal imaging. Insets to the right, including single channels. Black arrows indicate herniated mitochondria associated with LC3B-puncta. D–G Quantification of Airyscan images of Mcl1−/− MEFs expressing TOM20-Halo, TFAM-mScarlet, and GFP-LC3B shown in (C). D Number of LC3B-puncta per cell. E Number of LC3B-puncta associated with mitochondria. F Number of LC3B-puncta not associated with mitochondria. G The percentage of mitochondrial volume associated with LC3B puncta. Data is represented as n = 3 independent experiments where larger opaque large circles show average of each independent experiment, and smaller transparent circles represent individual cells (n = 10-20) within experiments. Circles are coloured to match individual cells with their experiment average. *p < 0.05, **p < 0.01 Paired student’s T-test. H Schematic of mKeima fluorescence excitation, which is dependent on pH, with the same emission. I Analysis of Mcl1−/− or Bax−/−Bak−/−Mcl1−/− MEFs expressing mtKeima, treated with DMSO, ABT-737 [1 µM] ± QVD-OPh [20 µM] for 8 h and 24 h, plotted as mean ± SEM, n = 3 independent experiments, paired data from the same experiment are represented by the same symbol shape. Statistical tests were performed as follows, D–G Unpaired Student’s t-test, *p < 0.05, **p < 0.01, ***p < 0.001. I Two-way ANOVA with Tukey correction for multiple comparisons, *p < 0.05, **p < 0.01, ****< 0.0001. Comparisons only performed between cell lines for each condition, only significant differences have been annotated on figure.

