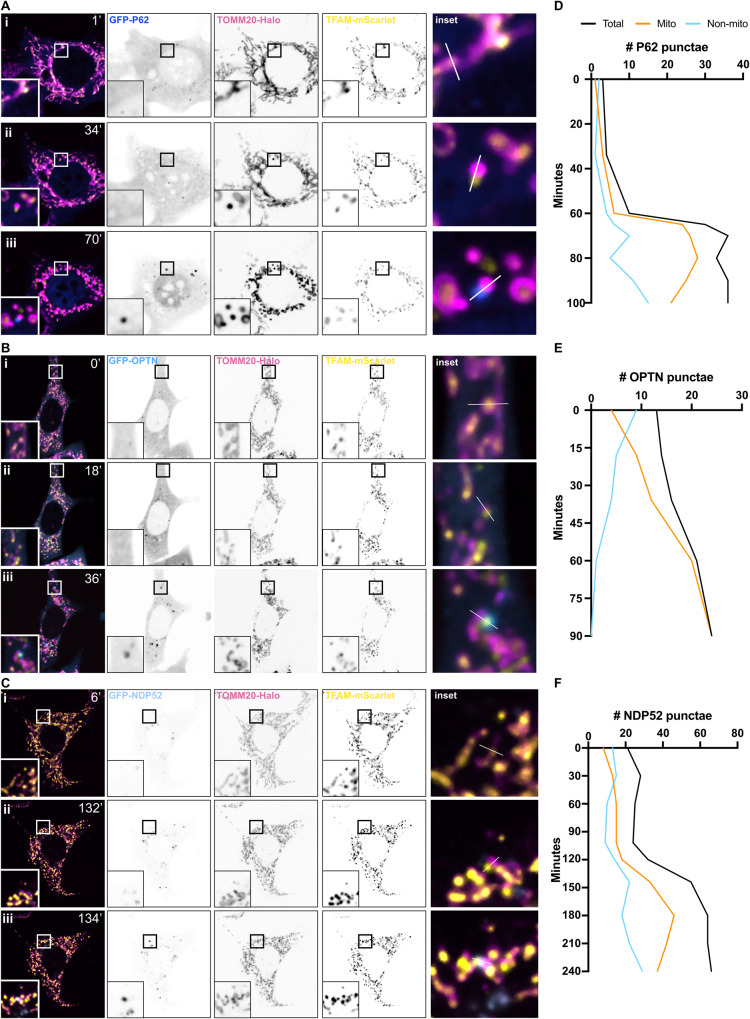
Fig. 4. Autophagy adaptor proteins, P62, OPTN, and NDP52, are recruited to herniating mitochondria.
Snapshots of live-cell spinning disk microscopy imaging of Mcl1−/− MEFs expressing TOMM20-Halo (stained with JF646) (pink), TFAM-mScarlet (yellow) and, either A GFP-P62 (dark blue), B GFP-OPTN (blue), or (C) GFP-NDP52 (pale blue). Cells were pre-treated with QVD-OPh [20 µM] and imaging began after the addition of ABT-737 [1 µM]. Panel (i) shows timepoint zero T0, immediately after addition of ABT-737, (ii) timepoint designated T2 immediately after mitochondrial herniation, and (iii) timepoint designated T3, upon clear recruitment of autophagy adaptor protein to herniated mitochondria. D–F Kinetic analysis of number of GFP puncta associated with mitochondrial signals. See also Movies 2, 3 and 4.

