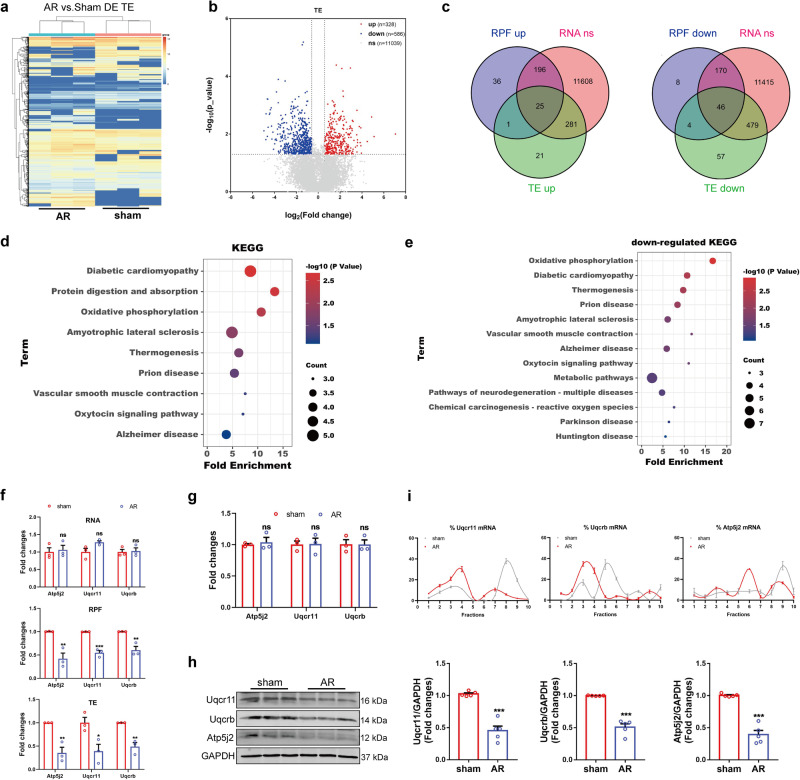
Fig. 2. The translational regulation in cardiac regeneration.
a Heatmap of differentially expressed TE. b Volcano plot of TE in heart tissues. A statistical test based on the H0 and H1 model fitting. c Venn diagram showing the overlap of genes of differentially expressed RPF and TE, and unchanged RNA. d KEGG analysis of genes with translational regulation by DAVID and HIPLOT. Fisher exact test. e The KEGG analysis of genes with down-regulated translation. Fisher exact test. f The fold changes of RNA (FPKM, F test), RPF (CPM, likelihood ratio test) and TE (FPKM, a statistical test based on the H0 and H1 model fitting) of Uqcr11, Uqcrb and Atp5j2 in RNA-seq and Ribo-seq data (n = 3 independent mice). g, h The mRNA and protein expression level of Uqcrb, Uqcr11 and Atp5j2 in AR heart tissues (g, n = 3 independent mice; h n = 5 independent mice). Two-tailed Student’s t test with g or without Welch’s correction h. i The translational regulation of Uqcrb, Uqcr11 and Atp5j2 in AR heart tissues analyzed by polysome profiling (n = 3 independent mice). *p < 0.05, **p < 0.01, ***p < 0.001 vs. sham group, ns, not significant. Data are presented as mean ± SEM. Source data are provided as a Source Data file. Exact p values are provided in the Source Data file.

