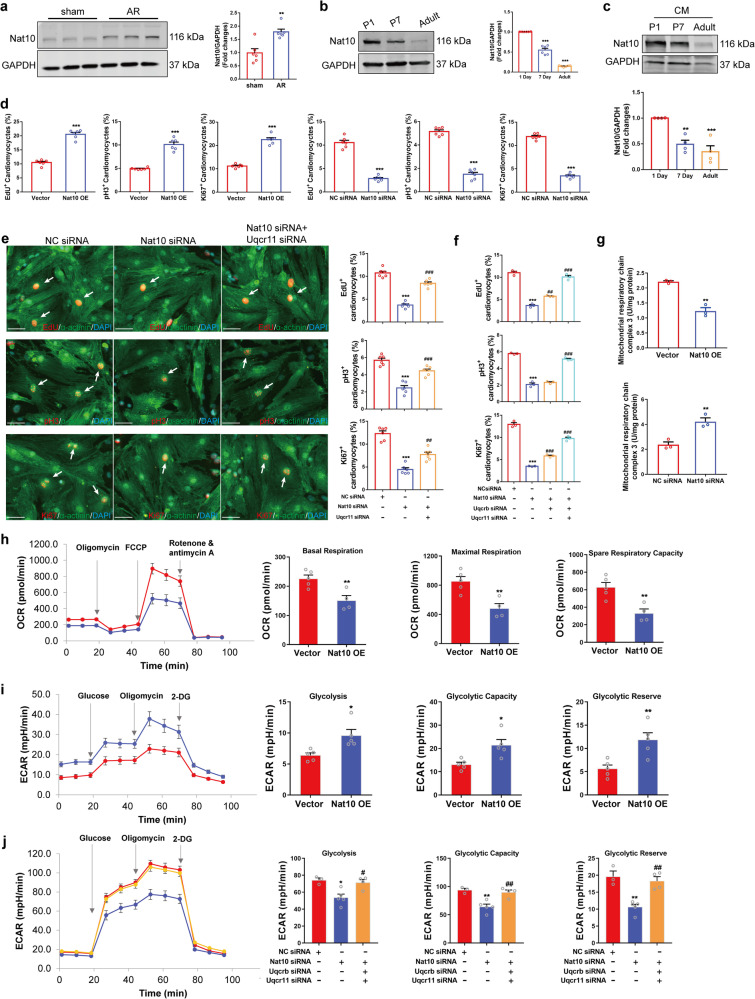
Fig. 5. Nat10 regulates cardiomyocyte proliferation by targeting Uqcr11 and Uqcrb.
a The expression of Nat10 in hearts of sham and AR mice (n = 6 independent mice). **p < 0.01 vs. sham group. b The expression of Nat10 in the heart tissues at different times points after birth (n = 6 independent mice). ***p < 0.001 vs. P1. c The expression of Nat10 in cardiomyocytes isolated from heart tissues at different times points after birth (n = 4 independent experiments from 8 mice per group). **p < 0.01, ***p < 0.001 vs. P1. d Immunofluorescence staining showing the expression of EdU, pH3 and Ki67 in cardiomyocytes with overexpression or knockdown of Nat10 (n = 6 independent experiments). ***p < 0.001 vs. Vector or NC siRNA. e, f The effects of Nat10 knockdown and rescued by Uqcr11/Uqcrb knockdown on cardiomyocyte cell cycle determined by immunofluorescence staining (e, n = 6 independent experiments; f, n = 3 independent experiments). ***p < 0.001 vs. NC siRNA, ##p < 0.01, ###p < 0.001 vs. Nat10 siRNA. White arrows point the positive cardiomyocytes. g The activity of mitochondrial complex III in Nat10-upregulated and -downregulated cardiomyocytes (n = 3 independent experiments). **p < 0.01 vs. Vector or NC siRNA. h Mitochondrial stress test in cardiomyocytes (Vector, n = 5 independent experiments; Nat10 OE, n = 4 independent experiments). **p < 0.01 vs. Vector. i Glycolysis stress test in cardiomyocytes (n = 5 independent experiments). *p < 0.05, **p < 0.01 vs. Vector. j Nat10 regulated glycolysis targeting Uqcr11 and Uqcrb (n = 3, 5, 4 independent experiments per group). *p < 0.05, **p < 0.01 vs. NC siRNA, #p < 0.05, ##p < 0.01 vs. Nat10 siRNA. Data were analyzed using Mann–Whitney two-tailed U test a, one-way ANOVA followed by Tukey’s Multiple Comparison tests b, c, e, f, j. Two-tailed Student’s t test with or without Welch’s correction d, g, h, i. Data are presented as mean ± SEM. Scale bar: 50 μm e. Source data are provided as a Source Data file. Exact p values are provided in the Source Data file.

