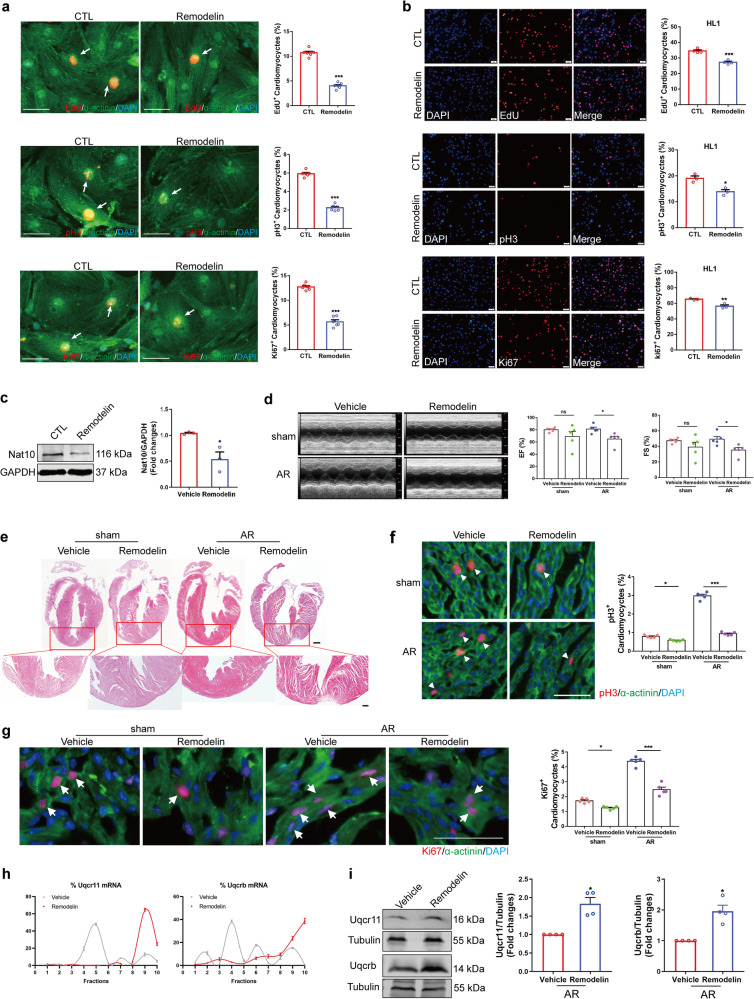
Fig. 9. The effects of Remodelin on cardiomyocyte proliferation and heart regeneration.
a Remodelin inhibited the proliferation of cardiomyocytes isolated from P1 mouse hearts determined by pH3, EdU and Ki67 staining (n = 6 independent experiments). ***p < 0.001 vs. CTL. White arrows point the positive cardiomyocytes. b Remodelin inhibited the proliferation of HL1 cells determined by pH3 (n = 3 independent experiments), EdU (n = 4 independent experiments) and Ki67 (n = 3 independent experiments) staining. *p < 0.05, **p < 0.01, ***p < 0.001 vs. CTL. c Representative western blots and statistics showing downregulated Nat10 in the hearts from Remodelin treated or untreated mouse hearts (n = 3 mice). *p < 0.05 vs. Vehicle. d Cardiac function by echocardiography one month after AR (n = 5 mice). *p < 0.05 as indicated. e HE staining at P28 after being treated with AR in P1 hearts (n = 3 mice). Scale bar: 500 μm (up) and 200 μm (down). f, g Heart sections stained with pH3, Ki67 and the corresponding statistics at 7 days after AR (n = 5 mice). *p < 0.05, ***p < 0.001 as indicated. White arrows point the positive cardiomyocytes. h Polysome profiling analysis of Uqcrb and Uqcr11 (n = 3 mice). i Western blot analysis of Uqcr11 and Uqcrb (n = 4 mice). *p < 0.05 vs. Vehicle. Two-tailed Student’s t test a–c, Two-tailed Student’s t test with Welch’s correction d, i, one-way ANOVA followed by Tukey’s Multiple Comparison tests f, g. Data are presented as mean ± SEM. Scale bar: 50 μm a, b, f, g. Source data are provided as a Source Data file. Exact p values are provided in the Source Data file.

