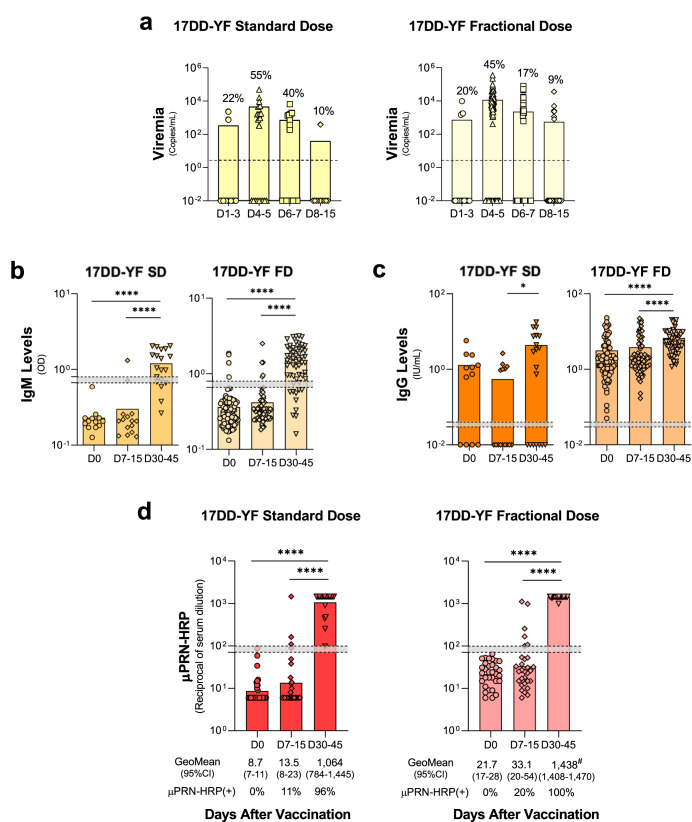
Fig. 1. Fractional and Standard doses of 17DD-YF vaccine induce similar viremia kinetics and comparable seroconversion rates.
a Viremia was quantified by qRT-PCR and data expressed as mean viral copies/mL ( = SD;
= SD;  = FD). Dashed line represents limit of detection (LOD): 3.45 Log10 copies/mL. b YF-specific IgM (
 = SD;
= SD;  = FD) and (c) IgG (
 = SD;
= SD;  = FD) were measured in-house ELISA and data expressed as mean OD for IgM and as mean IU/mL for IgG. d YF-specific neutralizing antibodies test was quantified by μPRN-HRP assay and data reported as GeoMean of reciprocal of serum dilution (
 = SD;
= SD;  = FD). The results are reported as scattering distribution of individual data at distinct timepoints (D0 / D1-3 =
  ; D4-5 =
  ; D6-7 =
  ; D7-15 / D8/15 =
  ; D30-45 =
  ). Dotted lines represent the gray zone. Data above gray background was considered positive. Significant intragroup differences are identified by Kruskal–Wallis test are represented by *p < 0.05; ****p < 0.0001. Intergroups differences in μPRN-HRP GeoMean, identified by Student t-test and represented by #.

