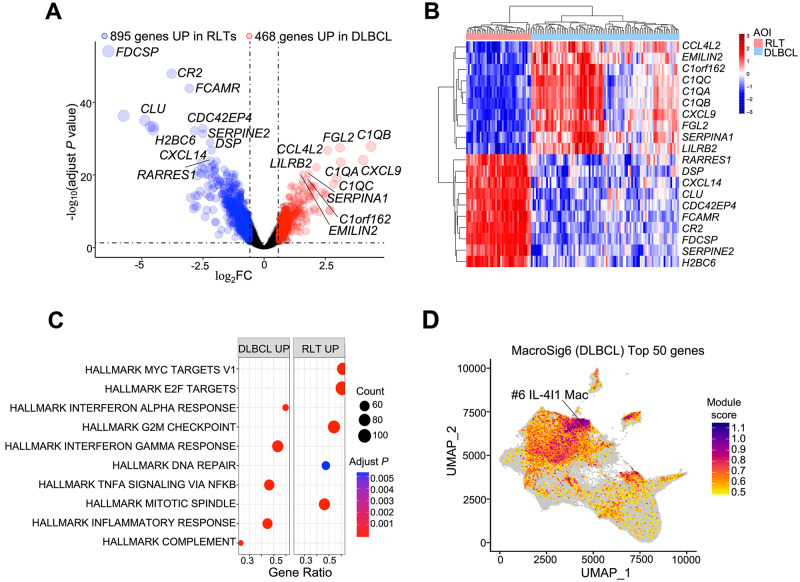
Fig. 3. Distinct transcriptomic profiles of macrophages between reactive and malignant lymphoid tissue.
A Volcano plot showing the macrophage DEGs between RLTs and DLBCL based on adjusted P < 0.05 and |log2FC| ≥ 0.58. P values were determined by two tailed moderated t test (BH corrected). B Top DEGs between RLTs and DLBCL are displayed in the heatmap. C Pathway enrichment analysis was performed on all macrophage DEGs between GC and DLBCL. P values were calculated by two tailed Fisher exact test (BH corrected). The top 10 pathways, based on adjusted P are shown. D Top50 genes of MacroSig6 (DLBCL) were projected onto MoMac-VERSE.

