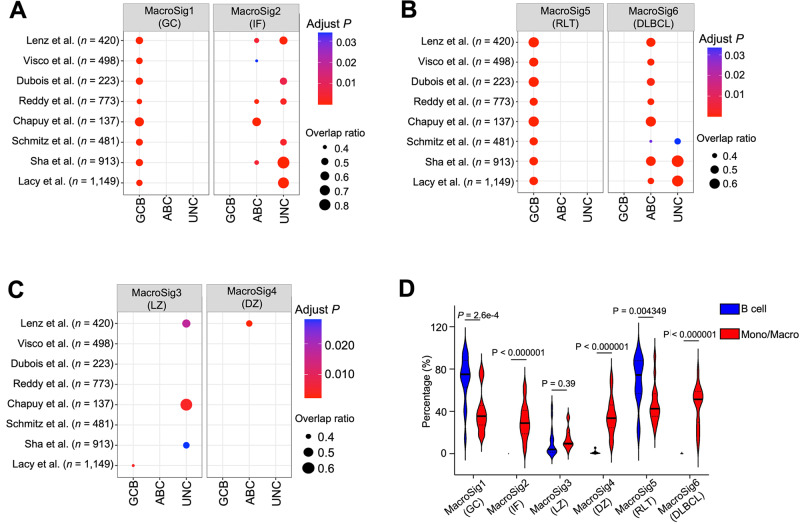
Fig. 4. Spatially-derived MacroSigs associate with COO DLBCL subclassifications.
The associations of MacroSigs with clinical categories (i.e., COO, genetic subtypes) were evaluated through the Fisher exact test. The overlap ratio refers to the number of patients classified as both a certain MacroSig and COO category, divided by the total number of patients classified in that particular COO category. A MacroSig1 (GC) and MacroSig2 (IF) were enriched in DLBCL COO classifications in bulk RNA gene expression profiles of DLBCL patients across eight publicly available transcriptomic datasets (n = 4594, 8 datasets). B MacroSig5 (RLT) and MacroSig6 (DLBCL) were enriched in DLBCL COO classifications in the above-mentioned eight datasets. C MacroSig3 (LZ) and MacroSig4 (DZ) were not distinctly enriched in any COO category in the above-mentioned eight datasets. D All genes of each MacroSig, through their respective module scores, were projected onto the Monocyte/Macrophage and B cell subsets of DLBCL scRNA-seq datasets (Ye et al; n = 17). The violin plot depicts, for each patient, the percentage of B cells and macrophages expressing a given MacroSig (module score > 0.1) The median and quartile bands are depicted. P values were calculated by a paired t test (see also Supplementary Figs. 5 and 6). Source data are provided as a Source Data file. Germinal center B-cell like, GCB; activated B-cell like, ABC; unclassified, UNC; monocyte/macrophage, Mono/Mac.

