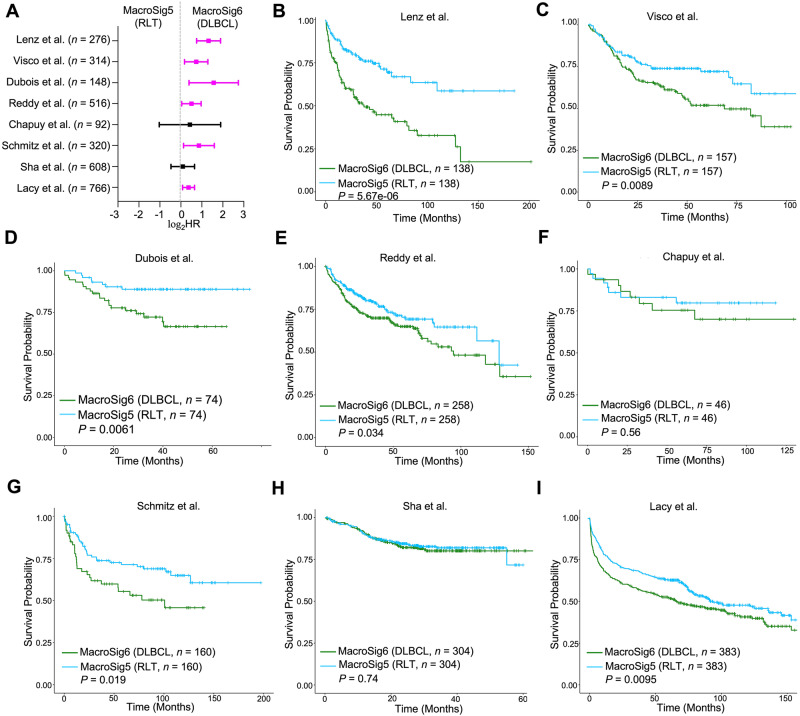
Fig. 5. Spatially-derived MacroSig5/6 (RLT/DLBCL) stratify for patient survival in DLBCL datasets.
A Forest plot depicting the univariate Cox proportional hazards model analysis, comparing MacroSig5 (RLT) and MacroSig6 (DLBCL) (represented as tertile groups, as described in Methods: Survival analysis). Analysis applied to bulk RNA gene expression profiles of DLBCL patients across eight publicly available transcriptomic datasets (n = 4594, 8 datasets). Data are presented as the 95% confidence interval of the hazard ratio (plotted in log-scale). Source data are provided as a Source Data file. B–I Kaplan–Meier analyses showed that patients with high expression of MacroSig6 (DLBCL) and low expression of MacroSig5 (RLT) were associated with poor OS across six distinct DLBCL datasets. P values generated by log-rank test. Overall survival, OS (see Methods: Survival analysis).

