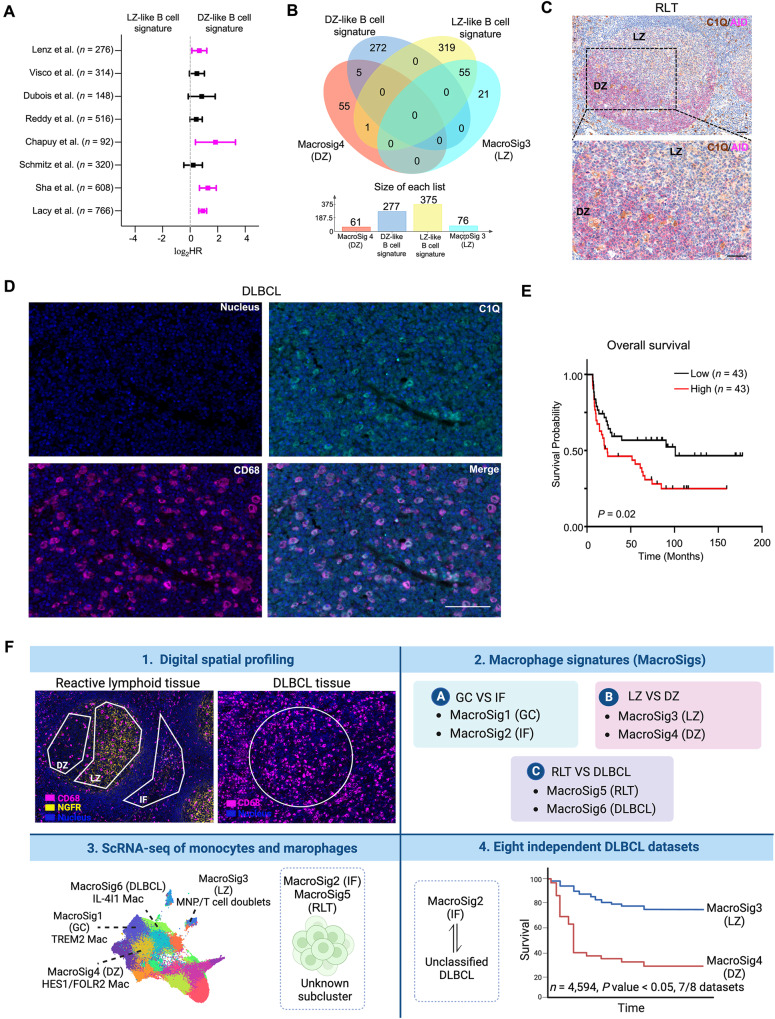
Fig. 7. Additional evaluation of the Dark Zone MacroSig hallmark C1Q in DLBCL.
A Forest plot depicting the univariate Cox proportional hazards model analysis, comparing B cell-based LZ and DZ signatures (represented as tertile groups, as described in Methods: Survival analysis). Analysis applied to bulk RNA gene expression profiles of DLBCL patients across eight publicly available transcriptomic datasets (n = 4594, 8 datasets). Data are presented as the 95% confidence interval of the hazard ratio (plotted in log-scale). Source data are provided as a Source Data file. B Venn diagram displaying the overlapping genes of LZ-, DZ-like B-cell signatures, and MacroSig3-4 (LZ and DZ). C Immunochemistry staining of RLTs was shown (n = 3). Activation-induced cytidine deaminase (AID) in magenta was used for illuminating the LZ and DZ. C1Q in brown stained macrophages. Scale bar: 100 μm. Source data are provided as a Source Data file. D Immunofluorescence stained CD68 + C1Q+ cells in DLBCL tissues (n = 86). Representative images are shown. Scale bar: 100 μm. Source data are provided as a Source Data file. E Kaplan–Meier analyses showed that patients with highly infiltrating levels of CD68 + C1Q+ cells were associated with poor OS in DLBCL patients in CMMC cohort. P value generated by log-rank test. F Graphical abstract summarizing the derivation of the spatial derived MacroSigs and describing their associations with known features of macrophage/ DLBCL biology and clinical outcome (created with BioRender.com).

