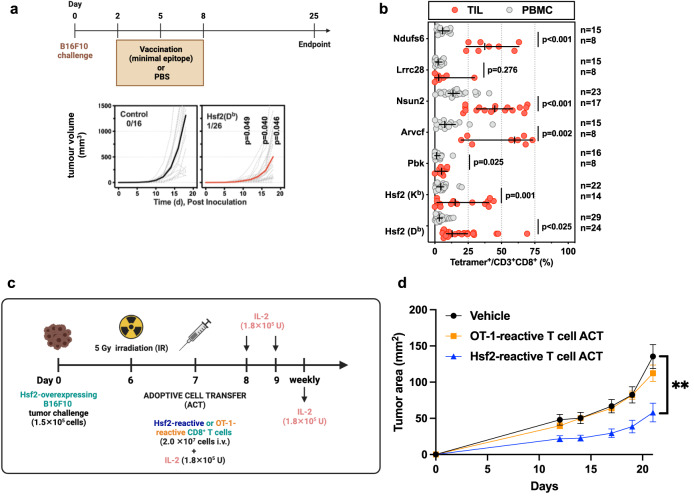
Fig. 4. Hsf2 neoantigen-reactive CD8+ T cells elicit anti-tumour activity in vivo.
a C57BL/6 mice (n = 16 independent biological replicates in control group and 26 independent biological replicates in the vaccinated group) were treated with Hsf2 neoantigen minimal epitope (YGFRNVVHI) vaccine or PBS (mock). Tumours were monitored via calipers. b Tetramer staining on CD3+ CD8+ T cells isolated from tumour-infiltrating lymphocytes (TIL) or peripheral blood mononuclear cells (PBMCs) from mice vaccinated with each of the neoantigens listed, as described in 2b. Symbol indicates individual mice, error bars depict the group median, ±95% confidence interval (CI) ± 95% confidence interval (CI), n values (shown on figure) represent independent biological replicates. Statistical analysis consisted of two-sided unpaired t-test, followed by Benjamini, Kreiger and Yekutieli two-stage step-up method, with desired false discovery rate (Q) of 5.00%. Ndufs6: p = 0.0000000279, Nsun2: p = 0.0000000825, Hsf2: p = 0.00053. c Schematic (made using Biorender with a full license) describing administration of adoptive cell transfer (ACT) of Hsf2-reactive T cells in vivo. n = 15 (vehicle group), 14 (OT-1 group), or 11 (Hsf2 group) C57BL/6 mice (independent biological replicates) collected over 3 independent experiments. d tumour growth was measured over time by calipers every 2–3 days and plotted using Graph Pad Prism 7. Error bars depict standard error of the mean. **p = 0.0036 (vehicle vs. Hsf2-reactive T cell ACT comparison), while for the comparison between OT-1-reactive T cell ACT and Hsf2-reactive T cell ACT, p = 0.0122. Two-way ANOVA with Tukey correction. Source data are provided as a Source Data file.

